
AuthorPaul Butterworth
Research Manager View profileOver 100 steel trade cases have been instigated globally over the past two years. At the time of writing, many remain either under investigation or duties, provisional or final, have been imposed. Few have been abandoned with no proof of harm.
Since 2015, the world has become more protectionist. What has spurred this? How has it affected global steel trade? And, what does it mean for future trade and for exporters?
The rising tide of protectionism
The imposition of trade defences by a country rarely does more than shift imports to more costly import sources, lifting domestic prices in the process and providing added protection for the marginal producers in the country. Using the US and China as examples, our analysis demonstrates that, even following the imposition of trade measures, the level of imports into the US and exports from China are no different from what might be expected, given domestic steel market conditions in each country.
The overall conclusion is that ‘steel can, and will, always find a home’. Importing countries will still require imported steel commensurate with their domestic demand requirements, dictated by underlying cost competitiveness and, in some cases, ability to produce certain grades of steel, neither of which are affected by trade measures.
Over the next 5 years, our analysis shows that steel trade should fall from the peak levels seen in 2016, primarily driven by lower exports from China, as its domestic market improves but it should remain above 2013 levels.
According to CRU’s database, more than 100 trade cases were brought in the last 2 years; the largest number of trade cases have been brought against China, although, all top-ranking exporters are key targets.
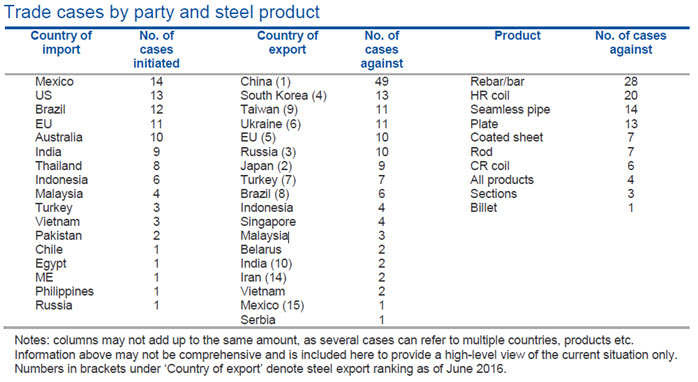
This suggests that simply being a major exporter of steel increases the likelihood that a trade case will be brought against a country regardless of the underlying factors in the case.
The table shows that the majority of trade cases have been brought against commodity grade hot rolled products (e.g. rebar and HR coil), whereas cases against higher value-added products, such as CR coil and coated sheet, are less prevalent. Although plate and seamless tube figures stand-out in this regard, it reflects particular surplus capacity conditions in these sectors. But what is the impact of the measures set out above and how have they affected trade flows?
What has spurred increased protectionism?
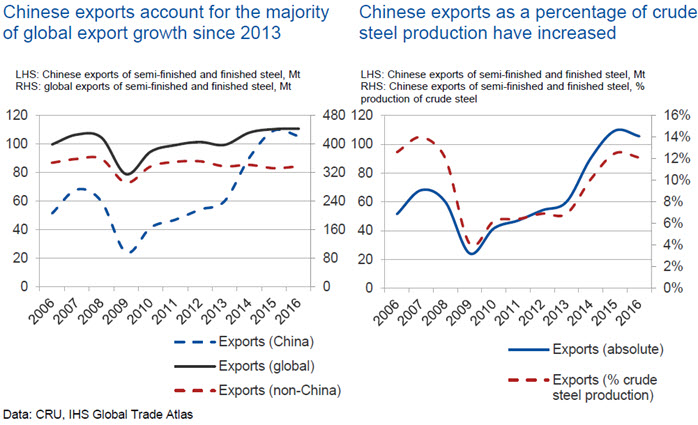
One of the main factors spurring the increase in trade protection over the last 2 years was the increase in exports from China from 2013 onwards. As the graphs below show, from this time, the total growth of global steel exports was entirely accounted for by increases from China and exports from China as a percentage of total steel production in the country increased to relatively high levels.
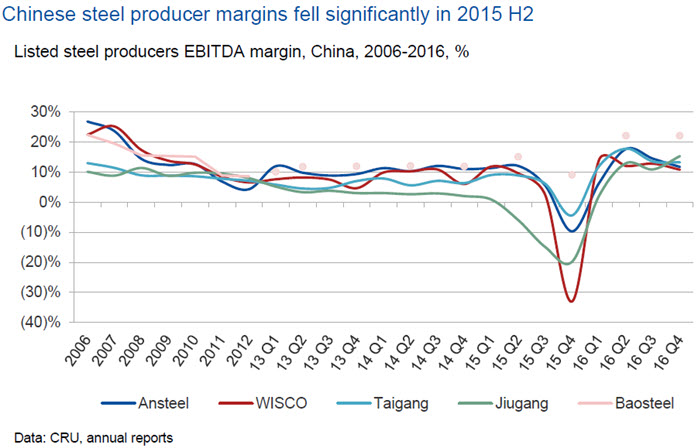
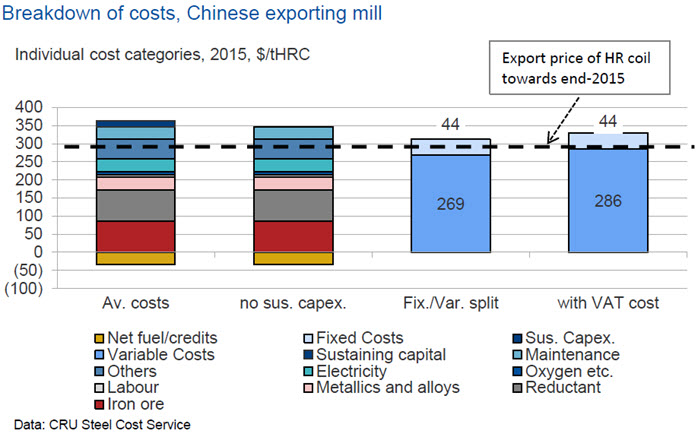
Initially, and particularly during 2014, increased exports from China raised few issues globally; the US steel market was strong and the country was readily accepting imports and steel markets elsewhere were performing well. Conditions changed in 2015, when global steel demand fell by more than two percent, and particularly in the second half of 2015, as demand in the Chinese steel market turned down rapidly, profitability of the steel sector there dropped to very low levels. CRU’s analysis of costs suggested that steel was being exported at prices close to variable costs (see charts on the next page).
This was not irrational per se, as Chinese steel companies were looking to survive the downturn and by the strict definition of the term1, this was not necessarily ‘dumping’ of steel on world markets as domestic prices were also very low at the time. However, these exports were causing harm to steel sectors elsewhere in the world, as other countries were in no position to accept the volume of material available, given their domestic market conditions.
During 2015 H2, China saw 60 Mt of capacity closures in response to the poor conditions, but the speed of the decline there, the size of China as a steelmaking nation, as well as the internal struggle between induction furnaces and large integrated mills for domestic market share, shifted the pressure to close capacity offshore. As a result, the number of trade cases, particularly against China, began to rise.
The impact of trade cases on China/US steel trade
In order to understand the impact on trade flows, the analysis below looks at imports into the US and how they have changed following recent trade actions, although it is suggested that the conclusions drawn from this analysis are likely to be applicable to other countries as well. The left-hand graph shows imports into the US since 2011 and the notional profitability of the steel sector in the country based on CRU’s understand of cost and price movements.
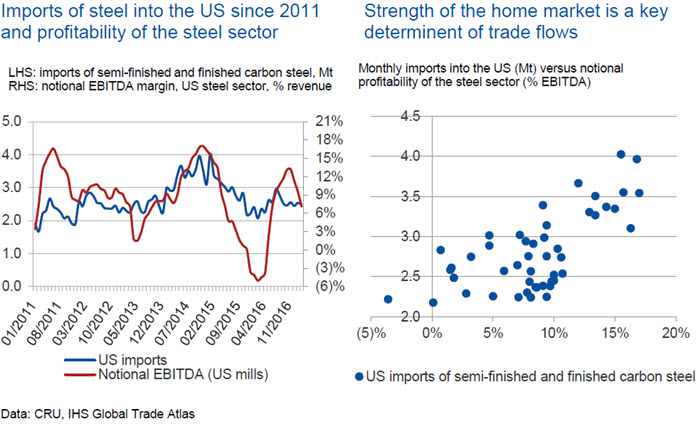
The first point to note is that there is a strong relationship, demonstrated in the right-hand scatter graph, between the level of imports and the strength of the domestic US market, as denoted by profitability of the steel sector. This bears out CRU analysis of steel trade flows, which demonstrates that 3 key factors determine steel trade between two countries. These include:
- Relative cost competitiveness of the steelmakers in each country,
- Strength of the steel market in the exporting country and;
- Strength of the steel market in the destination country
Any of these factors can drive steel trade between countries at any one time and, in practice, the primary factor can change on a relatively frequent basis.
We can see that, from end-2013 and throughout 2014, as the US market began to outperform other markets, this pulled imports into the country and imports overall lifted to a very high level. Equally, as performance in the US sector deteriorated in the second half of 2015, along with that in most other countries, imports began to fall off. Profitability of the US steel sector remained poor into early-2016, an extended period of poor profitability that stimulated the current round of trade cases. With duties subsequently applied to imports from a number of countries, these actions have begun to impact on trade flows. However, what is interesting to note is that, even though imports into the US are now more difficult for a number of key importers, including China, South Korea, Japan, Taiwan and Turkey, overall imports into the country are no lower than levels seen prior to the 2014 boom and sit in the middle of the range expected, given the current strength of the domestic market. Of significance, currently, overall exports from China are also within the range expected (n.b. not shown), given the strength of the Chinese domestic market, suggesting that the imposition of trade measures has not materially impacted its ability, or willingness, to export. So what does this mean?
What this suggests is that, despite the fact that duties and constraints of various sorts have been imposed on imports of Chinese and other countries’ material into the US, this has neither reduced the overall expected level of imports into the country, nor has it impacted on the expected level of exports from China. This is because the level of imports into the US and of exports from China, for example, are linked to the more fundamental drivers mentioned above and cannot easily be impacted by trade restrictions, other than through an outright embargo on imports or severe restrictions.
The imposition of Section 201 tariffs by the US government in March 2002, which simultaneously raised steel import tariffs to very high levels for a large number of countries, could be regarded as a severe trade restriction. There was a ~30% reduction of imports between 2001 and 2003, however, even in this case, it could be argued that a large majority of that fall was directly related to significantly deteriorated domestic market conditions in the US in 2003 and so would have occurred with or without the imposition of tariffs. During the time the tariffs were active, the profile of imports shifted to those countries that were exempt (e.g. Canada, Mexico, Turkey) as expected, but countries that were exposed to tariffs continued to provide some imports and the higher cost of these would have lifted steel prices in the US to higher than otherwise might have been the case. Section 201 tariffs were subsequently withdrawn in 2003, after they were deemed to violate US WTO commitments and following threats of retaliatory action by the EU. Following that, imports increased, but only in line with strongly improving market conditions.
What does this mean for trade flows generally?
As indicated above, the level of imports into the US currently are no lower than might be expected given domestic demand conditions, but the profile of supplying countries has shifted. It is difficult to determine a base case for comparison, but overall imports into the US in early-2012 were almost the same as those in early-2017. Comparing the supplying countries during these 2 periods shows the following:
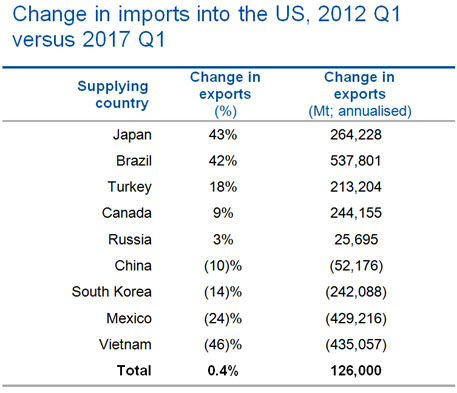
Although not conclusive, this table shows that the source of imports into the US has changed over the last few years. More material is now arriving on US shores from Japan, Brazil, Turkey and Canada, whereas fewer tonnes are arriving from China, South Korea, Vietnam and, interestingly, Mexico (n.b. reductions from Mexico may be linked to recent friction between the US and Mexico and the desire of the Trump administration to renegotiate NAFTA).
What this says to me is that the underlying drivers of trade – cost competitiveness, the strength of the domestic market and strength of the destination market – remain as relevant as ever. As such, given a certain set of conditions related to these drivers, there is a natural level of exports and imports and only extreme trade constraints or significant disconnects in the market are likely to undermine, or shift, this position to any degree.
For steel exporting countries, what this means in practice is that ‘steel can, and will, always find a home’. For steel importing countries, such as the US, the above analysis suggests that the overall level of imports is only likely to be affected marginally by trade restrictions, but imports will shift to the ‘next best options’ from a supplying country perspective. In practice, the ‘next best option’ implies a higher cost of imports, which will lift domestic prices and provide added protection for the higher cost steel producers in the country2, although underlying cost competitiveness will remain unchanged. However, longer-term, these conditions could have more significant structural impacts. That is, with higher prices, there is less incentive for steel producers to reduce costs and cost competitiveness is likely to deteriorate. Additionally, higher steel prices will undermine the competitiveness of downstream manufacturing and, unless trade barriers are erected across the whole of the steel value-chain, domestic demand is likely to fall, as steel-consuming sectors move offshore.
The outlook
So, what does this mean for global trade? As we have discussed, there are 3 key aspects to global trade – cost competitiveness, strength of domestic markets and strength of destination markets – that have a key influence on trade between nations. We have also heard that, given its size, China is central to the debate about global trade and steel pricing. But what can we say about these aspects of the trade equation over the next 5 years?
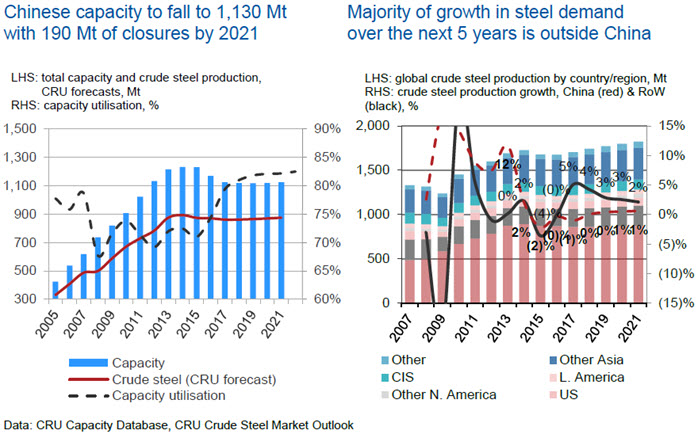
Firstly, the left-hand graph above sets out CRU’s view of capacity and capacity utilisation in China out to 2021. We are optimistic that China will achieve its capacity closure targets and, under our forecasts for steel demand, this should increase capacity utilisation in the country from ~70-75% currently, to something closer to ~85%. As the structure of the market improves, domestic market conditions (i.e. profitability) will also improve and the incentive for Chinese mills to export will diminish. Our analysis indicates that exports from China could fall to <70 Mt as a result, compared with 110 Mt in 2015. Globally, as shown in the right-hand graph, we believe that steel demand will grow over the next 5 years, therefore, ‘destination markets’ will improve and begin to pull in imports. However, we do not expect any significant mis-match in performance between countries and the net effect on trade flows should be more minor. Analysis using CRU’s Steel Cost Model shows some changes to cost competitiveness, but these are not sufficient to impact trade flows at the global level in a significant way. As such, we expect trade to fall from recent peak levels, primarily driven by lower exports from China, but to remain above 2013 levels.
Footnotes:
- According to the WTO definition, dumping is ‘the export by a country or company of a product at a price that is lower in the foreign market than the price charged in the domestic market’.
- The ‘next best options’ might not be much higher cost necessarily, so steady-state prices may not lift significantly, although, in the short-term, prices might spike, as trade flows adjust.
Steel Team
-
Paul Butterworth
Research Manager London -

Alexandra Anderson
Analyst Pittsburgh -

Chris Asgill
Head of Steel London -

Matthew Abrams
Research Analyst Pittsburgh -

Zain Ajlouni
Regional Director - MENA London