Costs Services

With more than 50 year’s experience of analysing commodities markets, CRU is a trusted source independent data and insight.
Market participants across mining and metals industries use CRU’s costs, cashflow and valuations data to understand the cost profile of assets, producers, regions and the wider sector.
Build a competitive market position by getting an accurate view of costs performance for individual assets and projects, including existing and prospective sites. Compare assets, producers and regions, benchmark costs and understand key cost drivers. Analyse cost drivers by operation and production volume, and compare cost curves by commodity.
Cost data is available with CRU’s Asset Services.
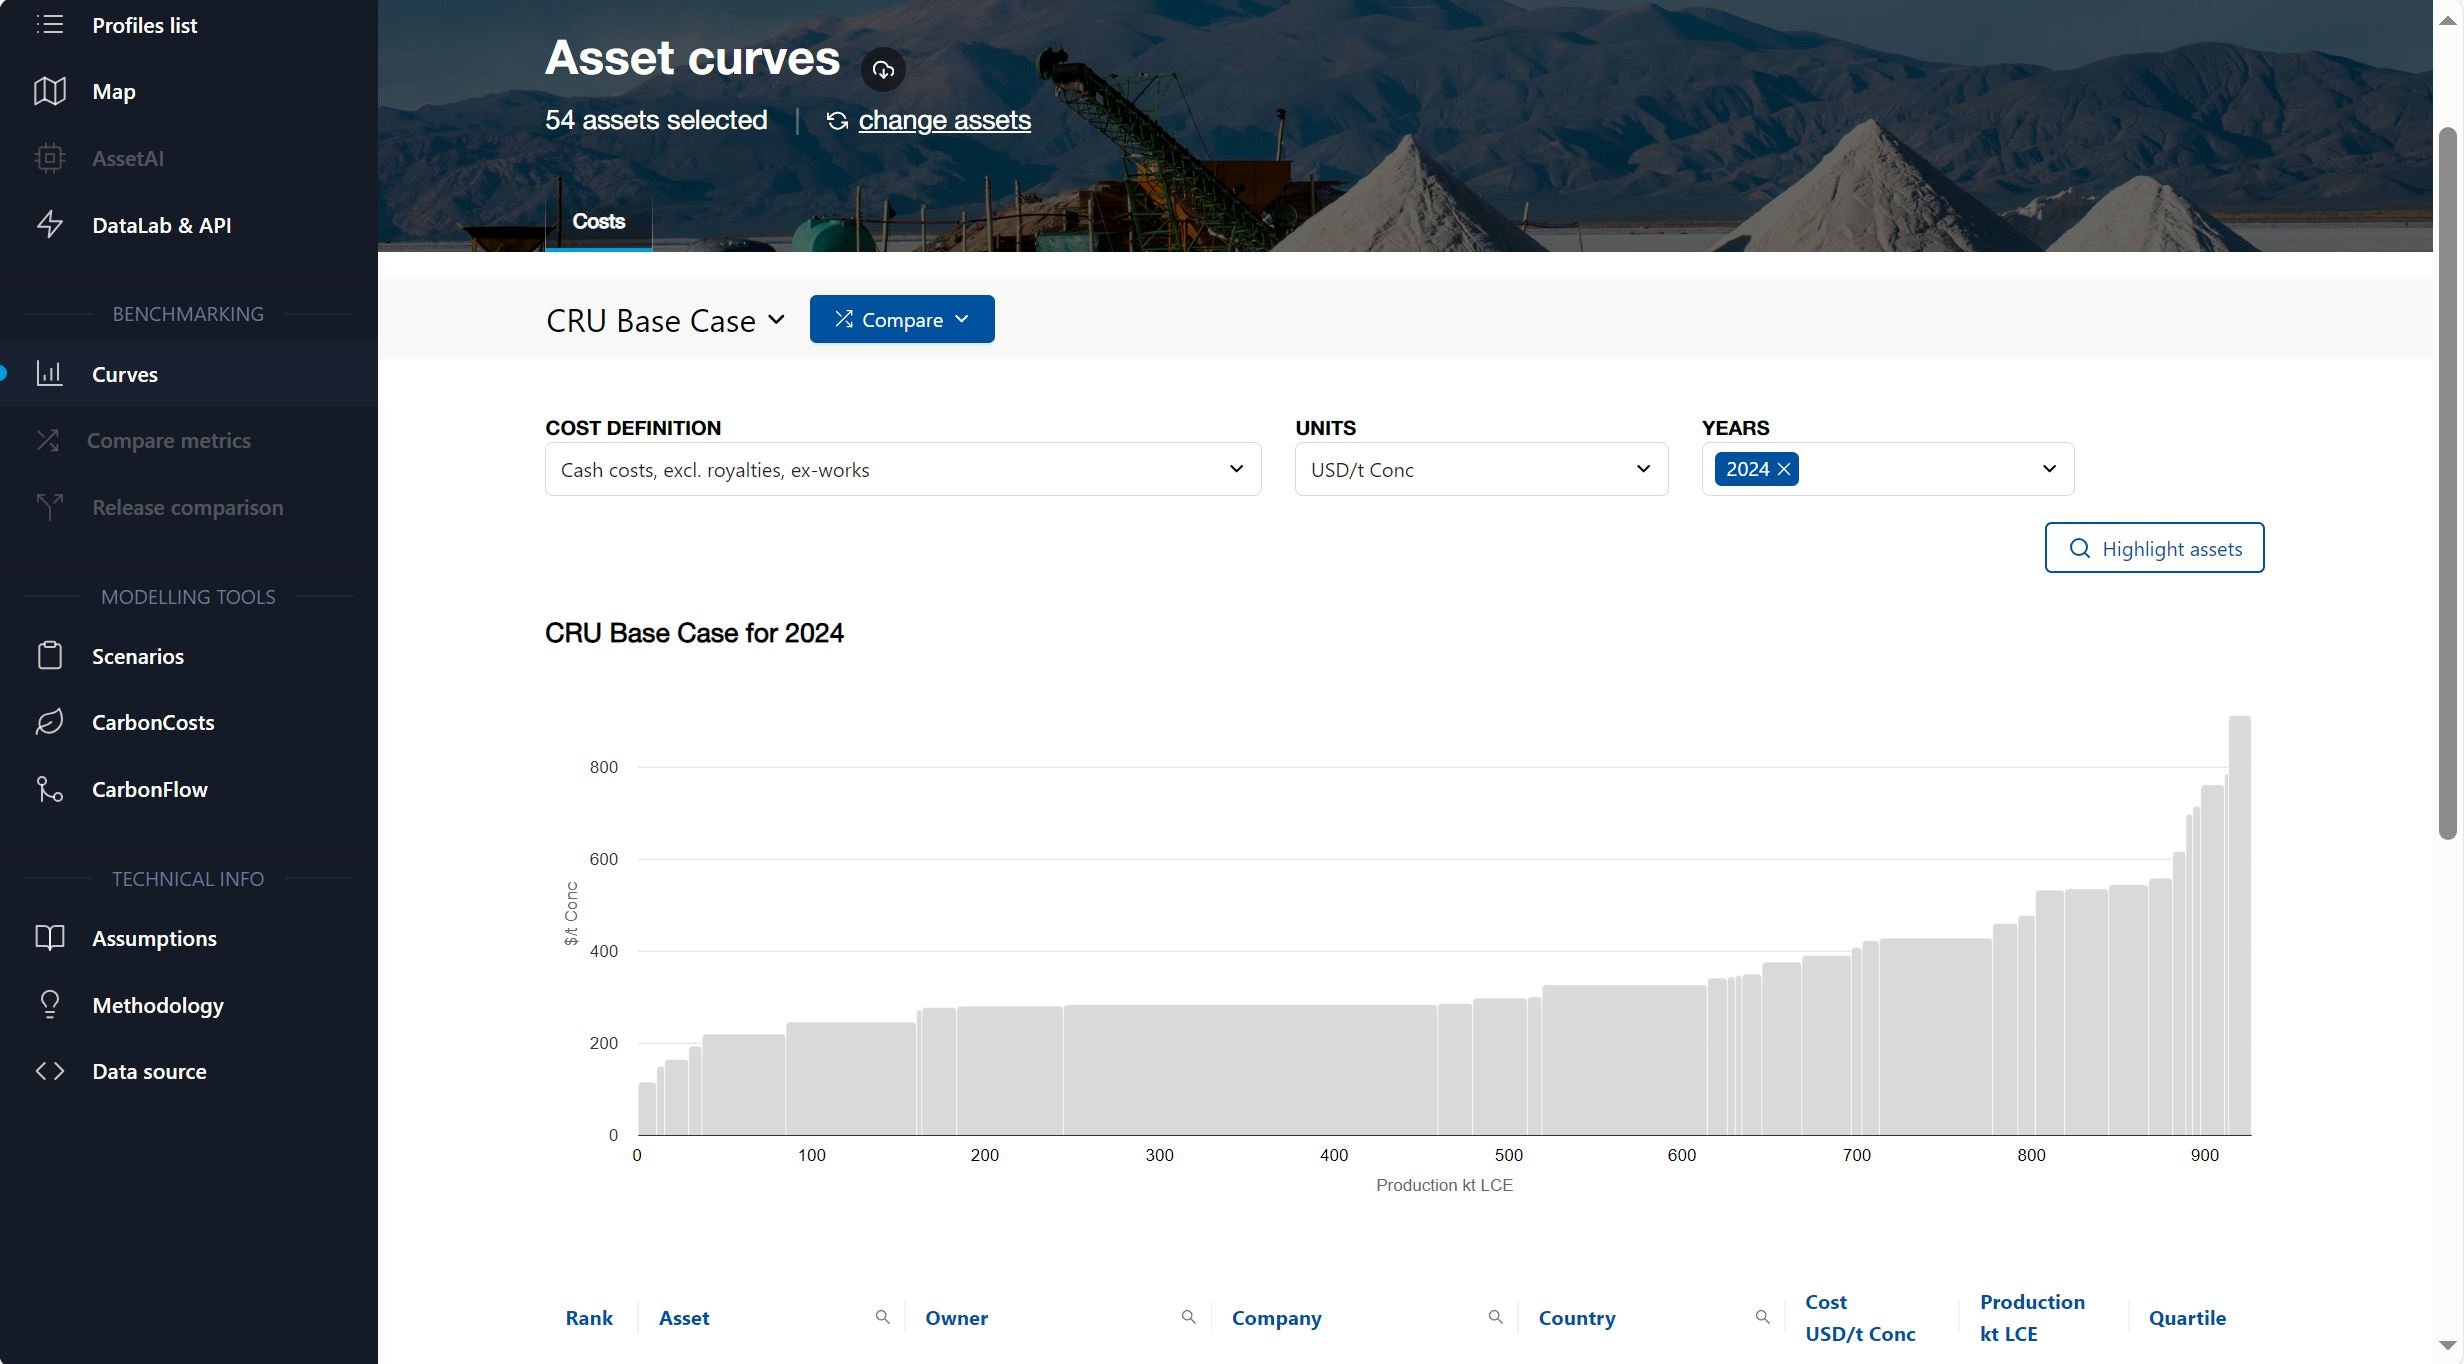
Stay ahead of the curve with CRU Asset Services
The web-based Asset Platform is the gateway to CRU’s Asset Services, offering seamless access to comprehensive, cost, cashflow, valuations and emissions data.
-
Access detailed bottom-up volume, cost, and technical data from our models in an easy-to-use, structured format for thorough understanding and benchmarking.
-
Modern UI design enables you to drill down quickly and easily into cost or emissions values, to understand underlying drivers such as inputs, material flows, and processes.
Analysis to drive informed decision-making
- Instantly benchmark key parameters against industry standards with dynamic tables and curves, to get to insights, fast.
- Compare cost curves against previous data with the release comparisons tool, to quickly track changes.
Advanced tools to build custom views and scenarios
- Create and upload scenarios to analyse potential impact on site cost positions.
- Integrate data seamlessly into in-house applications for enhanced accessibility, unlocking the full potential of data.
Sign up to receive CRU’s Newsletter
Sign upRelated commodities
Aluminium
For over 50 years, CRU has provided independent, data-led coverage of the aluminium value chain.
Learn More
Battery Materials
Our data, analysis, and expertise covers every step of the battery supply chain, driven by our unrivalled understanding of battery and raw material markets.
Learn More
Chrome
Our data and expertise cover every step of the silicon and solar value chain, driven by our unrivalled understanding supply, demand, costs and technology
Learn More
Coal
Our data and expertise cover every step of the silicon and solar value chain, driven by our unrivalled understanding supply, demand, costs and technology
Learn More
Cobalt
Our data and expertise cover every step of the silicon and solar value chain, driven by our unrivalled understanding supply, demand, costs and technology
Learn More
Copper
Market analysis, price assessments and forecasts, and costs and emissions analysis tools, providing data and insights through subscription services.
Learn More
Energy Commodities
CRU helps organisations understand the energy transition in the power sector, delivering insights and a wealth of data on power generation and capacity, using traditional thermal coal to cutting-edge solar PVs
Learn More
Ferroalloys
Comprehensive market analysis and forecasts, price assessments and cost services across ferroalloys worldwide.
Learn More
Gold, Silver, Platinum and Palladium
We provide market analysis for gold, silver, platinum and palladium, as well as price forecasts and cost analysis tools, giving you access to data and insights through subscription services.
Learn More
Iron Ore
We provide market analysis for gold, silver, platinum and palladium, as well as price forecasts and cost analysis tools, giving you access to data and insights through subscription services.
Learn More
Lead
Our data and expertise cover every step of the silicon and solar value chain, driven by our unrivalled understanding supply, demand, costs and technology
Learn More
Lithium
Our data and expertise cover every step of the silicon and solar value chain, driven by our unrivalled understanding supply, demand, costs and technology
Learn More