CRU DataLab - Discover the power of data
As the drive towards greater digitalisation accelerates, the seamless integration of data into systems and processes becomes ever more vital to connect data across organisations. Rapid access to reliable and consistent commodities data ensures companies are in the best position to respond to complex and shifting market dynamics.
CRU provides independent and valued data and insights that empower businesses to navigate the intricacies of industries such as mining, metals, and fertilizers. Our extensive coverage spans commodity value chains, delivering reliable and consistent data that is crucial for informed decision-making.
Explore, analyse and integrate data with CRU DataLab
CRU DataLab, our cloud-based platform, makes it easy to access and analyse data, to get insights, fast. It allows for centralised analysis, visualisation, and download of CRU’s commodity price, cost, and emissions data.
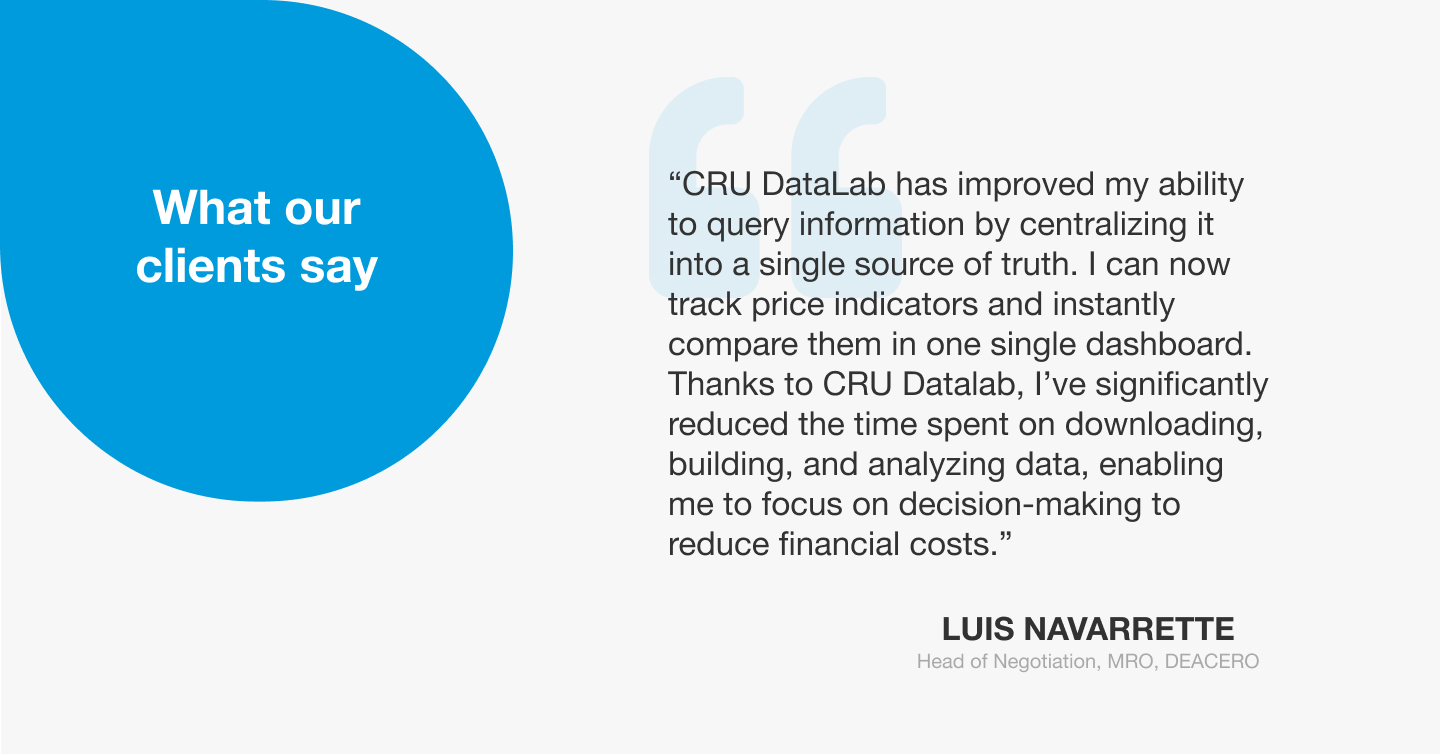
DataLab puts the power of data at your fingertips, offering a dynamic and user-friendly interface for efficient and unparalleled data interrogation.

Enhanced accessibility and seamless integration
DataLab offers a single source of data for use across organisations, with direct delivery into in-house applications and data analytics stacks via an API.
With API delivery, CRU data can be ingested and analysed alongside other data in a way that is seamless and removes friction. In turn, making it easier and more efficient to drive data-led analysis and decision-making across your entire organisation.
API delivery is available with an enterprise license.

Data discovery and visualisation
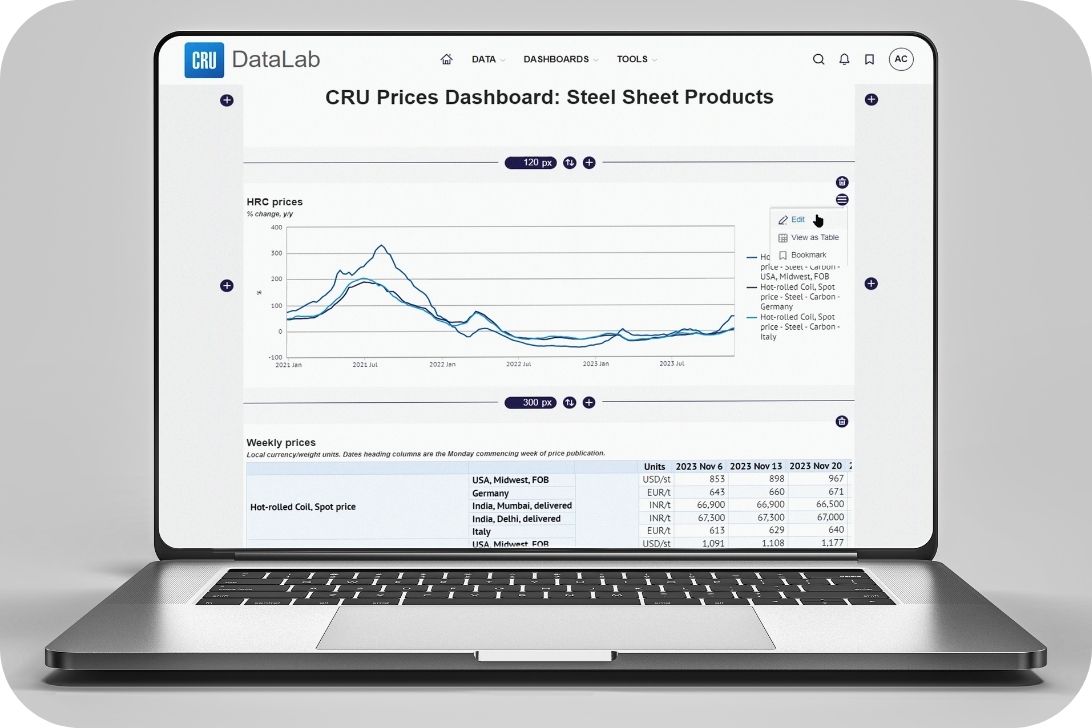
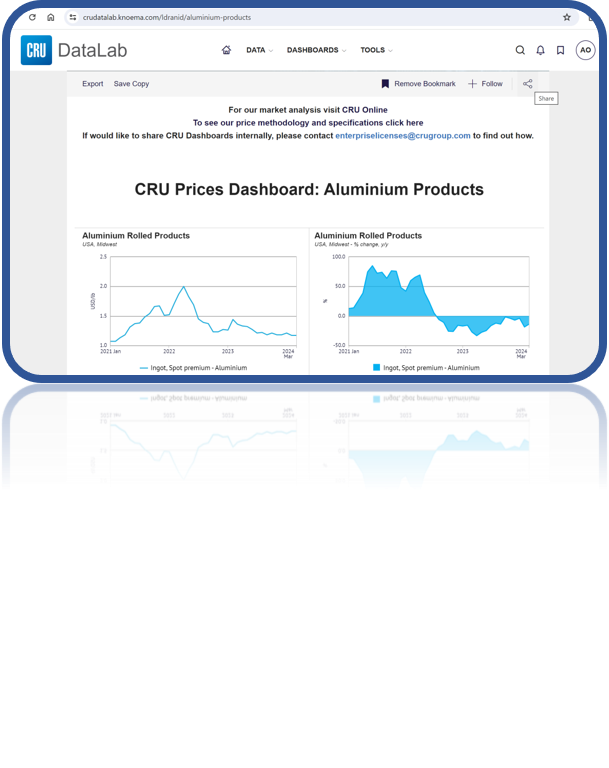
1000+ CRU assessed prices are available in DataLab, alongside cost and emissions data for more than 3900 assets. The customisation features in DataLab enable you to get more from data more quickly by connecting datasets and creating custom visualisations in dashboards for efficient data analysis. Charts and graphs can be customised, saved and set to refresh and update automatically, whilst the option to download them into reports and presentations saves time.
Do more with your data
![]()
Access insight that can accelerate decision-making

Build custom dashboards to track and analyse market movements
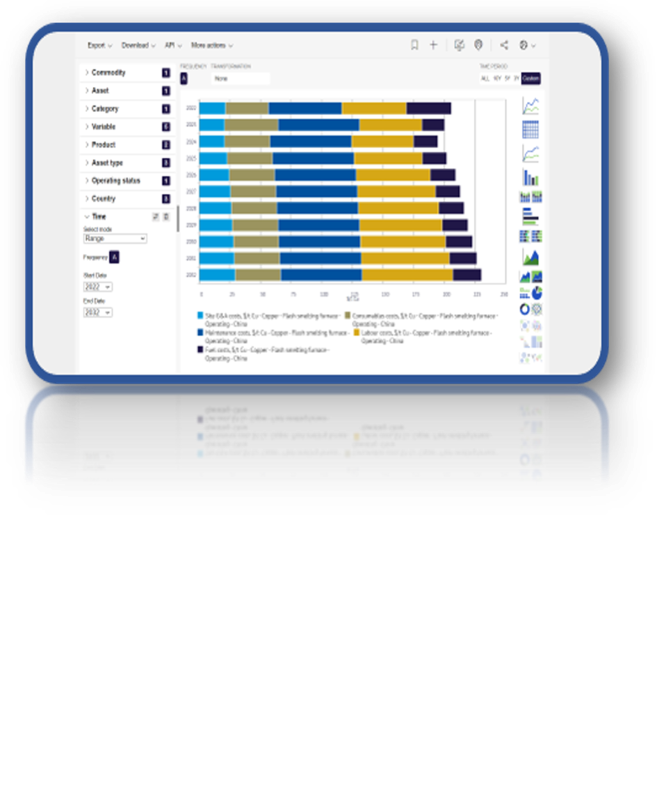
View cost and emissions data across commodity value chains for more than 3900 assets
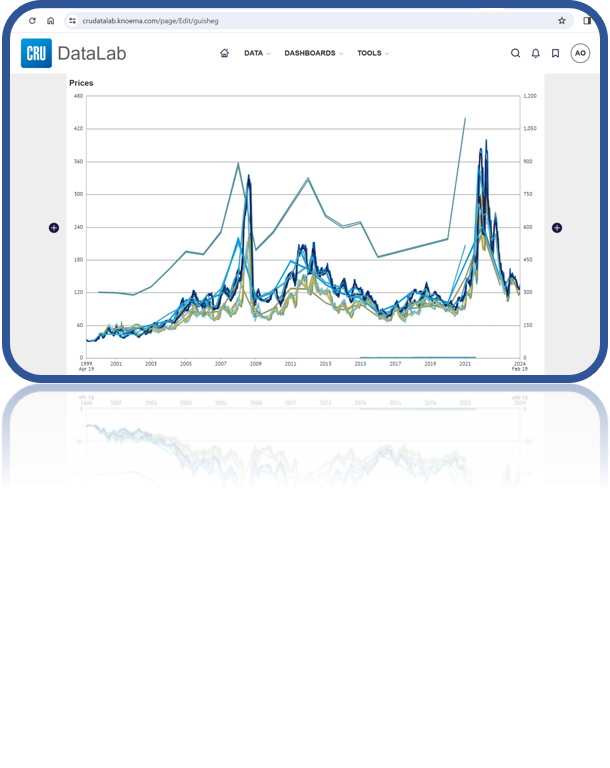
Visualise insights from a comprehensive database of 1,000+ assessed prices
Seamless integration that provides a single source of data for use across organisations