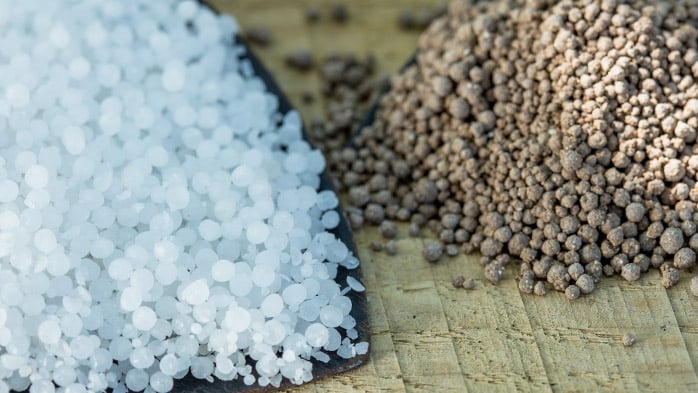
The growth in NP/NPK capacity has accelerated in recent years as demand has increased and producers have attempted to find markets with improved margins. Why has the market developed along its recent path and how could the growth trend change in the future?
Fertilizer consumers are increasingly demanding products which are more closely tailored to the specific needs of specific crops. The weakening of global fertilizer prices has also pushed producers to diversify and seek margins in more varied markets. The NP and NPK sectors have been an area which producers have looked to. Compound NP and NPK products can offer this specific supply of primary nutrients but are also increasingly supplying secondary and micro nutrients. The move into NP/NPK products has allowed suppliers to differentiate products and build a brand within demand markets which has sought to provide more stable and reliable consumption.
Development of global NP/NPK capacity
Europe was the historical centre of NP/NPK capacity but the share of the global market has declined. This decline has been partly due to a reduction in total capacity but also because of growth in other regions. China has increased capacity from ~5 Mt in 2000 to ~70 Mt in 2016 which has boosted the country’s share of global capacity. Much of the growth in Chinese capacity has been in physical compounds (steam granulation, compaction, urea melt) with growth in chemical compound capacity at a much lower level. Operating rates are higher in Chinese phosphoric acid and nitro phosphate based capacity than in the physical compound sector. Growth in capacity in South and South East Asia has targeted offsetting import demand whereas increase in capacity in the CIS has sought to increase exports.
Switching from DAP/MAP to NP/NPK
The growth in capacity has been due to the commissioning of new plants and the conversion of DAP/MAP capacity. This switching of capacity has been at operations which are based on phosphoric acid and has been focussed in the USA, India, Russia and Morocco. US capacity increases have been due to switching of capacity to produce NP+S products. In India, Russia and Morocco, capacity has been reconfigured to add the capability to produce NP+S/NPK whilst maintained the flexibility to produce DAP/MAP. Has the flexibility to move between DAP/MAP and NP/NPK allowed producers to maximise margins by moving between the product classes to match supply to demand.
Regional demand overview
Growth in demand for products has accelerated the rate of change in the configuration of capacity. The West European domestic markets have shown slow growth but East Europe and CIS have had much stronger increases in consumption. USA and Brazil have shown rapid adoption of new NP+S products with demand also growing in Africa, India and SE Asia. African demand growth has been split between NPK in West Africa and NP+S in East Africa. Many markets in Africa issue tenders for imported volumes with these tenders amounting to a volume of 2 Mt over the last 12 months. The Chinese market is split between imports of 16:16:16, based on chemical production routes in Russia and Europe, and domestically produced products from both chemical and physical production.
Conclusion
Weakening of margins in DAP/MAP markets and growing demand for NP/NPK has presented an opportunity to producers to grow margins and differentiate products. The move into NP/NPK capacity is happening in all major production regions and the balance of the future market will rely on demand growth remaining robust. Africa has been a region which has grown strongly but there are obstacles to the recent rate of growth being maintained.
CRU is launching a new NPK Market Outlook shortly. For more information or to order your copy, email fertilizers@crugroup.com.


