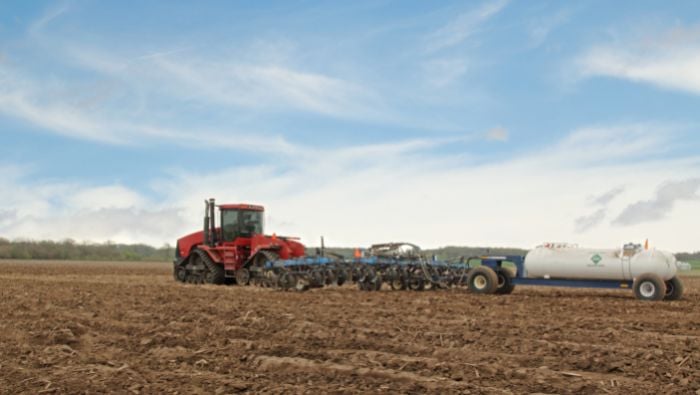
Major investments in the US by CF Industries and OCI have added 3.1 million tonnes of UAN capacity. This has allowed the US to reduce its dependency on imports of UAN and increase its share of global exports.
This change was anticipated but the UAN market now has to adjust to the structural change. The current low-price environment has squeezed the margins of traditional exporters and now most of the world’s low-cost production is operating in the largest end-user market.
New UAN capacity pressures global markets
The investment by CF Industries in Donaldsonville resulted in the US exporting more than 1 million tonnes of UAN in 2016; its largest annual exports. CRU’s 2017 forecast is for further but less substantial growth in 2017. CF has expanded its Donaldsonville port and built new UAN production capacity which enables it to increase exports. The Donaldsonville UAN plant will increasingly be dedicated to supplying product to export.
In 2016, France was the second-biggest importer after the US, importing more than 2 million tonnes of UAN. Since 2016, CF has had a supply contract with Invivo, a major French co-operative buyer, which imported around 400,000 tonnes into the French market. In the first five months of 2017, France imported 190,000 tonnes UAN from the US this was 80,000 tonnes more than in the same period a year earlier. Argentina, another large and developing UAN market, saw US market share rise from 15% in 2014 to 75% (300,000 tonnes) in 2016, according to US trade data. This change shows how competitively the US is now placed for international exports.
Higher US supply affects key importers
The largest impact will be in reduced UAN imports by the US, which typically were 3 million tonnes before 2016. Traditionally Russia, Trinidad and Tobago and China provided 75% of US imports.
CF can react quickly to demand for UAN around the US Gulf and along the US East Coast using ocean-going barges to deliver UAN at competitive prices. This will primarily displace imports of FSU UAN on the US East Coast.
The impact of the new capacity is best depicted by delivered costs of traditional offshore suppliers compared to domestic production and transporting it to the Corn Belt in the US.
Most US UAN production operated by PotashCorp, Agrium, Koch, Simplot, Yara, LSB, CF and CVR is located in and around the Corn Belt, with low transportation costs to end users. All of these, except for the pet-coke driven CVR unit, are based on low-priced natural gas. The newest and most efficient UAN unit—the Iowa Fertilizer Co./ OCI plant in Wever, Iowa—is in the heart of the Corn Belt. Its total cash operating costs are around $80/t FOB plant, while total delivered costs are just over $100/t.
Canadian plants also have attractive natural-gas prices and so have very competitive cash costs ex-plant, offset slightly by higher transportation costs to the Corn Belt.
The MHTL plant in Trinidad can likely deliver product to the Corn Belt at just under $150/t, leaving it with a modest margin.
The not-so-gradual trade take-over by US production and the evidence from 2016/17 show a complete change in the supply chain. UAN prices this year are some of the lowest since 2009 in the current over-supplied markets. This has seen Black/Baltic Sea and Egyptian producers reduce output or run extended maintenance to reduce supply.
China’s major export producers are uncompetitive in the US Gulf. Jinkai and Anhui Huaihua both started 500,000 t/y export-focused plants in 2013/14, and the US West Coast received two thirds of the 200,000 tonnes exported in 2016. The Chinese producers have already reduced UAN production for most of 2017 and did so for some of 2016 due to the low-price environment squeezing margins. We believe that this trend is likely to continue over the long term with most of the world’s low cost production now operating in the largest end-user market for UAN.


