CRU Consulting built capabilities to model reliable and comparable plant-level emissions for manganese products. A recent CRU Consulting study found the global average emissions intensity in 2023 is 3.9 tCO2/t for manganese ferroalloys and 5.1 tCO2/t for electrolytic manganese metal (EMM). This emissions data provides the producers and end-users of those products with the tools to consider decarbonisation options, benchmark their emissions against competitors and analyse the impact of emissions on costs.
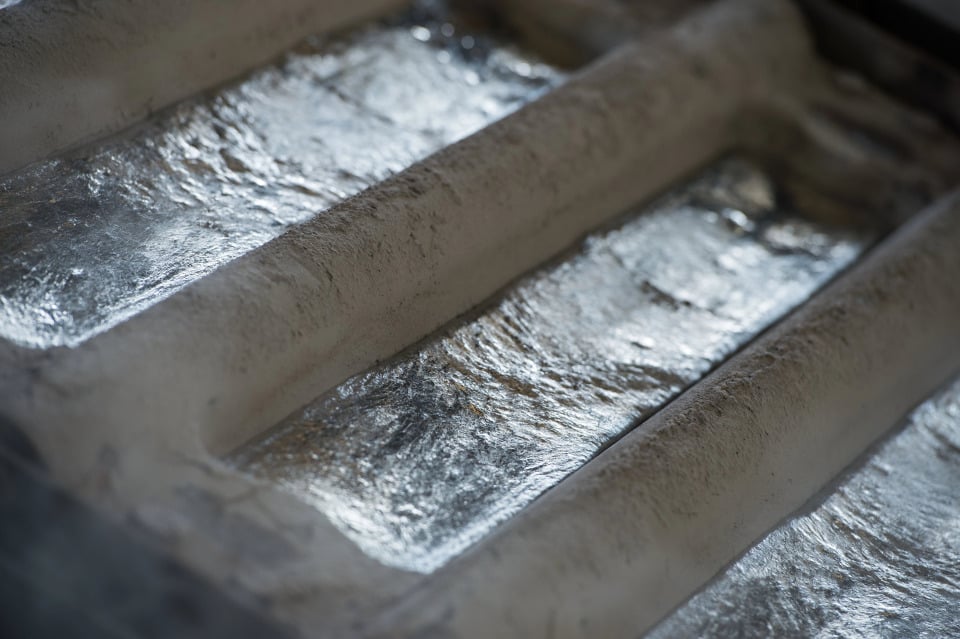
90% of manganese products are used as an input in steelmaking and steel alloying (including in stainless steel) under ferroalloy form, as it improves the strength, workability and resistance of steel products (the remainder is used in batteries, agricultural products and non-metallurgical applications).
For manganese producers and steelmakers, CRU Consulting has been modelling and analysing the Scope 1 and 2 CO2 emissions of producing high-carbon ferromanganese (HC FeMn), refined ferromanganese (Ref FeMn), silicomanganese (SiMn), low-carbon silicomanganese (LC SiMn) and EMM.
Emissions curves are populated with actual plants and representative plants in line with the coverage of CRU Cost Service for manganese products – see the example of the 2023 global HC FeMn emissions curve below. Mass allocation (by weight) or economic allocation (by value) of emissions can be produced where applicable. In practice, slag generated in the FeMn alloy production process hold sufficient value for the economic allocation to be applicable and differentiated from the mass allocation.
Scope 1 bio and fossil-CO2 emissions are driven by the carbon content in raw materials (i.e. manganese ores for manganese ferroalloys or HC FeMn slag as input for SiMn production), the carbon content in final products and slags, consumption of reductants (coal, coke, charcoal, etc.), fluxes and other miscellaneous inputs.
Scope 2 emissions are estimated based on a location-based basis, i.e. using the country or regional average electricity generation emission factor for each plant. For manganese products, Scope 2 CO2 emissions intensities have greater variability than Scope 1 emissions intensities and are typically the key differentiator when considering Scope 1 and 2 together.
A recent study by CRU Consulting found that the global average Scope 1 and 2 emissions intensity in 2023 is 3.9 tCO2/t for manganese ferroalloys and 5.1 tCO2/t for EMM (see bar chart below).
On a global average, HC FeMn has lower Scope 1 and 2 intensity than Ref FeMn on average. This occurs as Ref FeMn production can be achieved via the converter process route or the silicothermic process route. The converter route consumes HC FeMn hot metal for oxygen refining, removing carbon content from typically 7% in HC FeMn to achieve 1% in R FeMn. The silicothermic route consumes manganese ore that is reduced using a mix of coke and SiMn.
HC and Ref FeMn also have markedly lower emissions intensities than SiMn and LC SiMn on average. Si Mn has a higher Scope 1 intensity and lower Scope 2 intensity than LC SiMn due to the use of silicon scrap in LC SiMn production, which reduces the coke unit requirements but increases the electricity consumption for melting energy.
For EMM, the chemical composition of the manganese ore (carbonate or oxide ore) used in the production process is the key driver of Scope 1 emissions. However, Scope 2 emissions are larger as they are generated by high power consumption at the electrowinning stage.
Emissions data for manganese products will enable:
- end-users like steelmakers to consider decarbonisation options of their value chain by identifying cost efficient, low-carbon manganese products
- manganese ferroalloys and EMM producers to benchmark their emissions against competitors
- all stakeholders to assess the impact emissions on their costs and provide the ; this in the context of a) regional carbon pricing schemes (e.g. EU ETS, South Korea ETS) and b) carbon border taxes like the incoming CBAM in the EU that will affect traded goods
To learn more about manganese products emissions and how CRU can help customers, please get in touch.