Environmental, social and governance (ESG) scrutiny continues to intensify across extractive industries, and fertilizers is no exception. Governments, shareholders, financiers, and other stakeholders are increasingly incorporating ESG into decision making and capital raising.
Investment in potash fertilizers by major miners, such as Anglo American and BHP, has been driven, in part, by its apparent green credentials. Production of potassium chloride – the most popular form of potash – emits substantially lower levels of greenhouse gases (GHGs) than most nitrogen or phosphate fertilizers. But the industry is facing new legislation targeting GHG emissions in key producing regions like Canada and the European Union. This insight, and the latest edition of the Potash Cost Service, analyses how new emissions legislation would pressure costs across the industry and at individual facilities. It also estimates the volume of CO2 emitted per tonne of potassium chloride production and how that differs across the world.
MOP: the “cleanest” of the fertilizers?
In addition to the environmental impacts of chemical fertilizer application, the emissions associated with the fertilizer production process has also received significant attention. Much of the focus has centred on the nitrogen sector due to its use of fossil fuel feedstocks. In contrast, potassium chloride (MOP) – which accounts for around 85% of total potash demand – has so far largely avoided similar levels of environmental scrutiny. In part, this is because it occurs naturally as the mineral sylvite and as its production generally requires very limited chemical processing. Instead, the industry mostly uses conventional underground mining and physio-chemical beneficiation. These are substantially less energy-intensive than the chemical processes used to create most phosphate and nitrogen fertilizers. Nevertheless, a sizeable portion of the industry is facing the prospect of new legislation designed to encourage reductions in emissions.
New emissions legislation is spreading globally
Canada and the European Union have enacted legislation which could impact the potash industry. The Canadian government has introduced new carbon taxes to encourage decarbonisation and a reduction in emissions. The federal tax of CAD10 /t of emitted CO2 in 2018 will grow by CAD10 /t per year until it reaches a maximum of CAD50 /t in 2022. The Saskatchewan and Ontario provincial governments have challenged the new law. However, if the tax is fully implemented, around a third of global MOP supply (Canada is the world’s largest MOP producer) faces the prospect of higher production costs.
In the European Union, emission limits are placed on major polluters under the European Carbon Trading Scheme. The EU is considering the implementation of the Carbon Border Adjustment Mechanism or a carbon tax for goods imported into the European Union. The new tax would add a direct cost on to any imports into the European Union from countries that do not have a carbon pricing mechanism equivalent to the one currently in operation in the EU. The tax would also force non-EU exporters to report emissions data to a level required for domestic EU producers.
While not a market of notable growth, CRU estimates European MOP demand in 2019 accounted for 10% of the global total. The region is an important downstream market for producers in Russia and Belarus as well as the Middle East. The implementation of a border tax could aid the competitiveness of ICL – Iberia and K+S Germany assets.
How can emissions be compared across producers?
CRU has analysed CO2 emissions for MOP using our bespoke, bottom-up cost models. The models estimate the energy requirements and CO2 emissions for each stage and process within MOP production. The estimates are generated from CRU models and leverages our primary research and understanding of each specific production asset.
Emissions reporting varies widely between regions, and the numbers presented by companies are often not uniform in their scope. By examining the energy requirements of each component of an asset, CRU can generate directly comparable emissions estimates between individual sites in different parts of the world, including facilities which do not report any information.
CRU primarily examines emissions on a scope 1 and 2 level, which captures emissions associated with on-site activities. Direct emissions are generated in MOP production by the mining of the ore, its beneficiation, and the general and administrative functions. The emissions are driven by two factors:
The consumption of fuels and power at each stage, such as the electricity requirement at the mill or a diesel truck moving around the site.
The feedstock used to provide the energy (e.g. diesel, natural gas, coal) as each hydrocarbon has a different emission profile.
After estimating the energy requirements for each process within the three stages, the carbon intensity of the thermal fuel and electrical power for each plant is calculated. From the energy requirement and carbon intensity of the energy feedstocks, the overall carbon intensity of the site can be deduced.
What drives emissions on an asset by asset basis?
The emissions of an individual production facility can vary significantly depending on capacity, mining and beneficiation processes, energy source and geographic location. Nevertheless, there is a clear distinction in emission levels across the industry between conventional underground mines and brine-based producers. Sites which extract potash from brines (either natural or created through solution mining) generally consume significantly more energy. The processes involved in extracting potassium salts from brines, such as hot leach or vacuum crystallisation, are substantially more energy intensive.
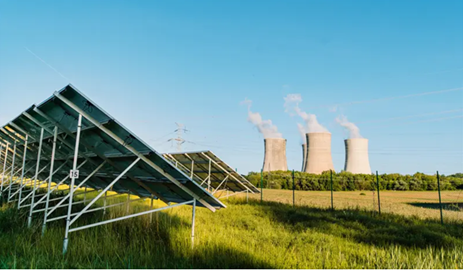
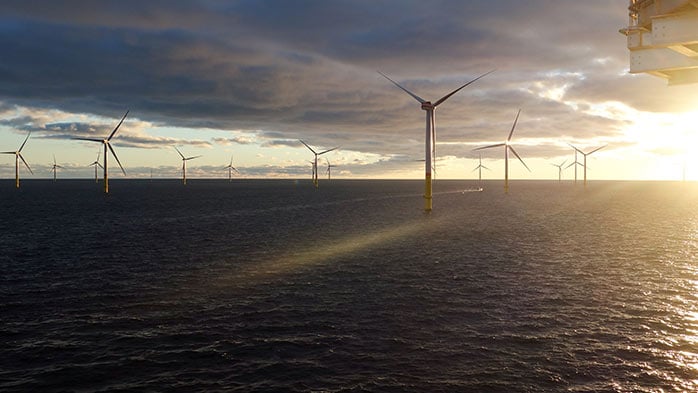
Facilities with access low carbon energy sources, such as renewables, can also perform much better than their energy profile may suggest. A smaller asset, which is less energy efficient due to smaller economies of scale, might be able to perform better than larger assets due to a low carbon energy source. An understanding of the assets production process, but also its energy sources, is critical to understanding the potential exposure to new emissions legislation for a particular company.
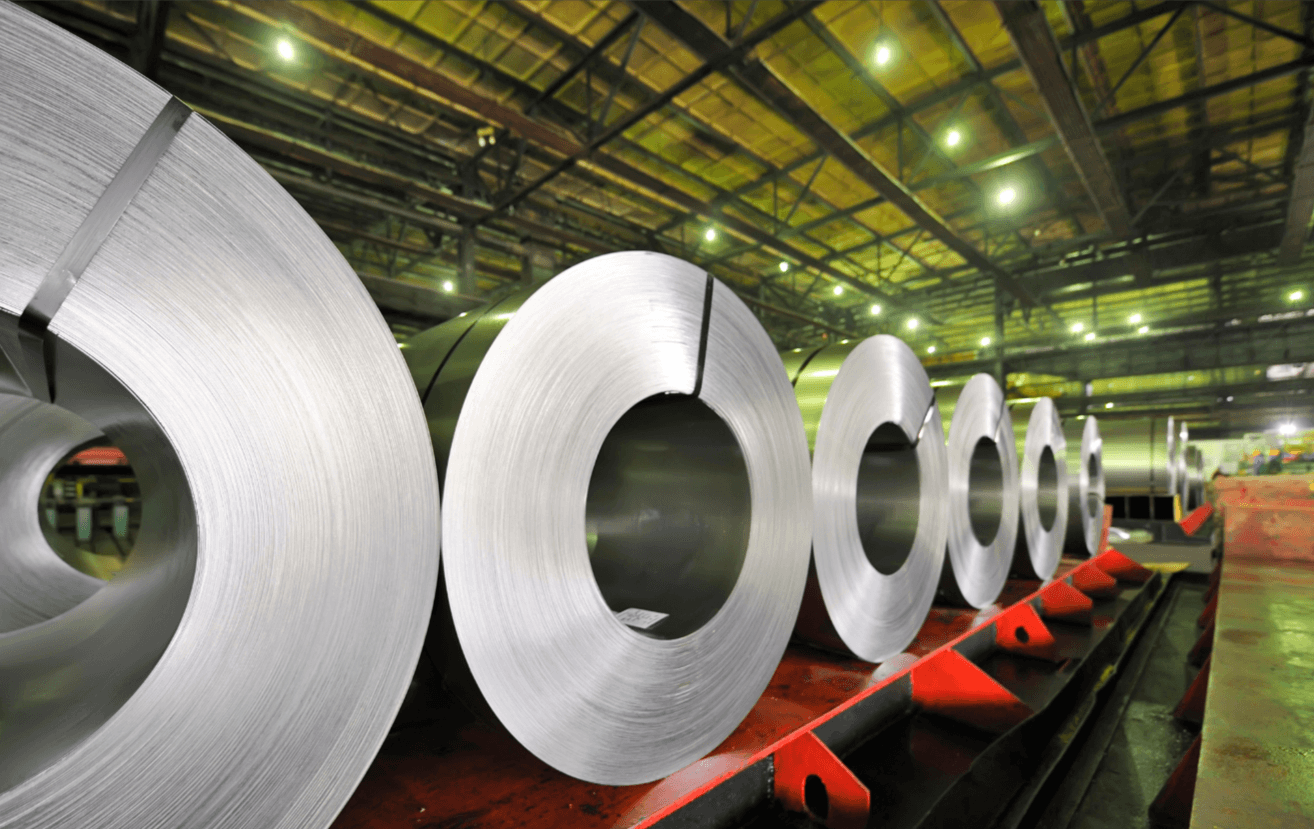
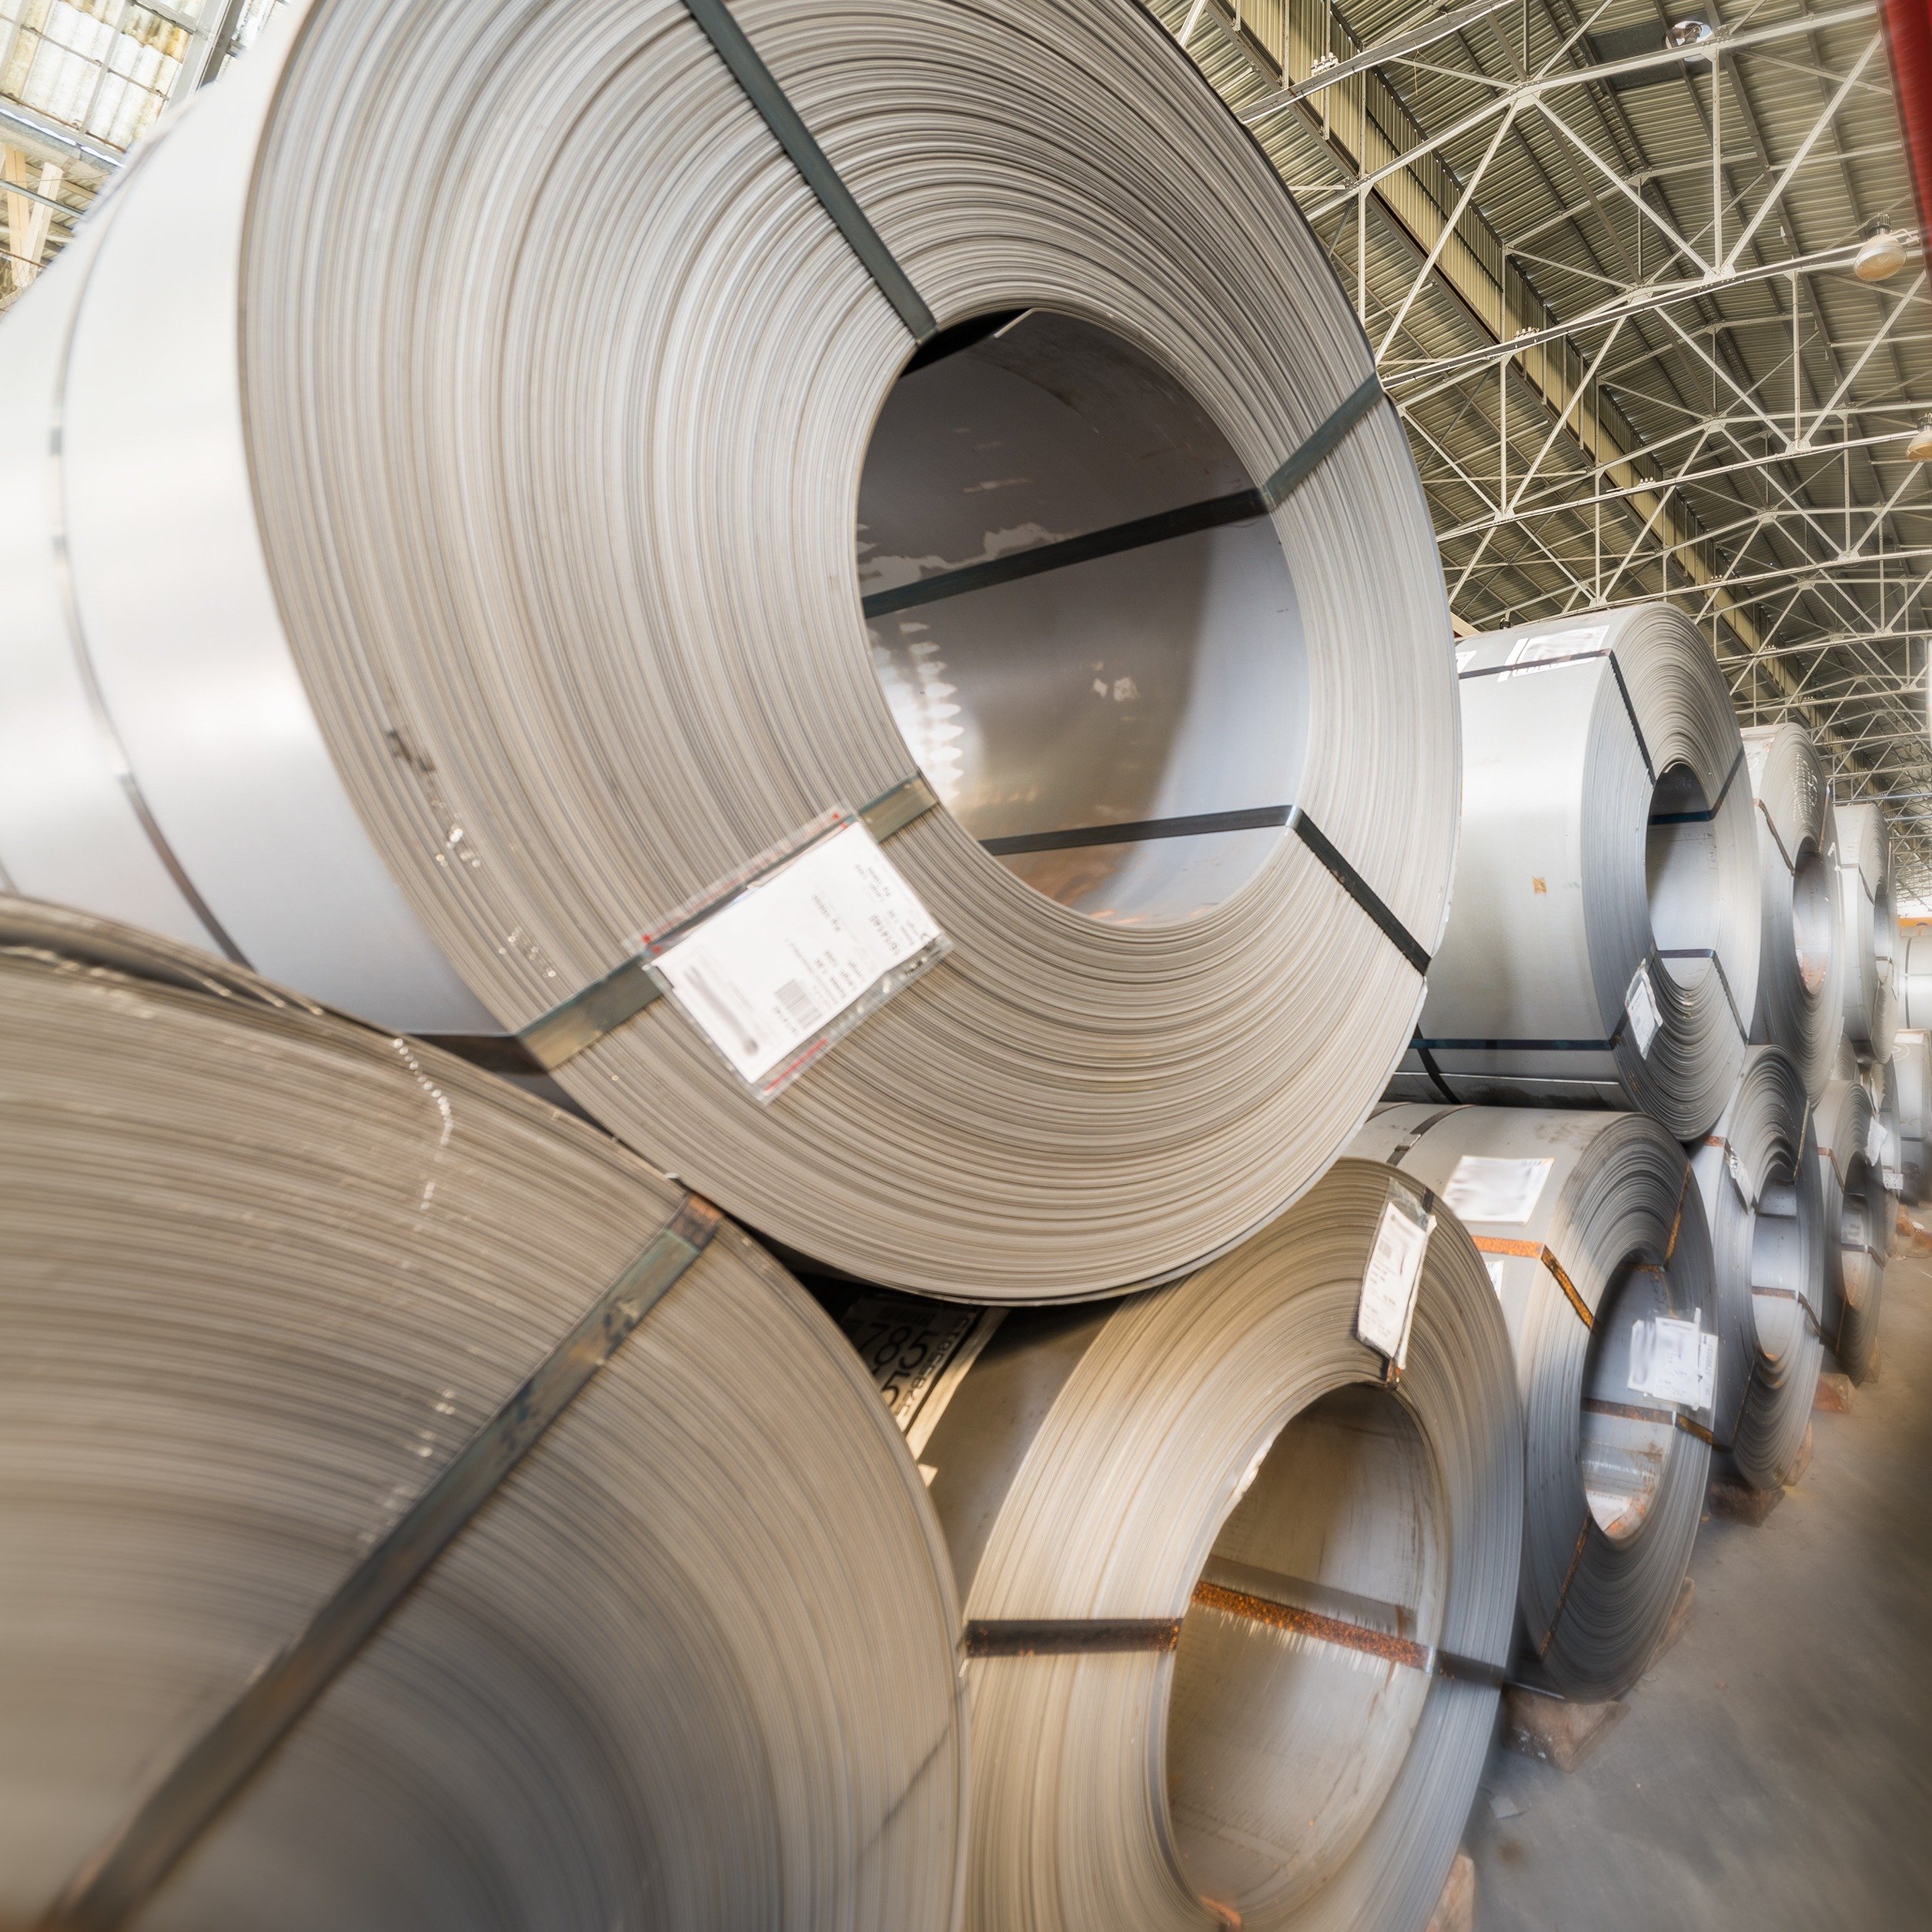
Overall, even the highest emitting MOP producer is producing substantially less CO2 than some of the least polluting steel products and ammonia. Ammonia production can be extremely carbon intensive, highlighting why much of the emissions focus is on this sector.
The graph below, which plots asset by asset CO2 emissions per tonne of MOP against cumulative capacity, highlights that only around 10 Mt/y of total capacity (substantially less than 20% of the global total) emits significantly more CO2 than the rest of the industry. While large portions of the industry look set to fall under some carbon taxing schemes in the future, only a small number of assets will see a significant increase in production costs as a result.
Further analysis on this topic and more information on MOP cost competitiveness can be found in our Potash Cost Service. CRU is continuing to develop emissions data across all three nutrients; nitrogen, phosphates, and potassium. We are constantly receiving feedback, questions and comments around both our methodology, assumptions, and outputs. If you have further questions or comments, please contact Alexander Derricott via the button below and we would be happy to discuss.