Limiting the increase in global average temperature to, or below, 1.5-2˚C versus the pre-industrial level is the ultimate goal as outlined in the Paris Agreement.
To realise a low-carbon future, this requires a unified large-scale transition to clean energy and electricity generation by renewables plays a critical role in this shift. Renewables are expected to provide 30% of global electricity generation by 2024, according to the International Energy Association (IEA).
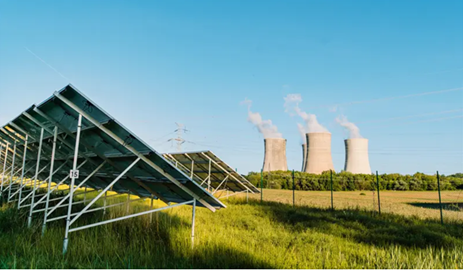
Beyond this, many nations are also injecting increasing investment into the green revolution as a lynchpin for economic recovery in a post-Covid-19 world. With renewable technologies typically more cable intensive than traditional fossil fuel-based generation methods, it will become an increasingly important driver of future wire and cable demand.
In this four-part series of Insights, CRU’s Wire & Cable Team explore three of the most cable-intensive renewable technologies and take a look at future capacity growth and implications to cable demand. While CRU have made part 1 publicly available, parts 2-4 remain exclusive to CRU’s Wire and Cable Market Outlook subscribers:
1. Onshore wind: an essential part of the energy transition roadmap
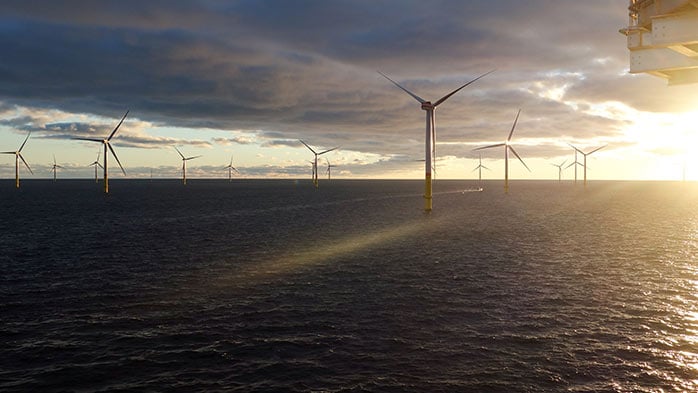
2. Offshore wind: cable intensive and rapidly growing
3. Solar: a certain bright spot for future wire and cable demand
4. Summary: a comparison of key renewable technologies and cable demand
Industry background
Over the last four decades, the evolution of the onshore wind industry has been remarkable in terms of installations, technology advancements and very importantly, cost reductions. By the end of this year, onshore wind is set to consistently offer a less expensive source of new electricity than the lowest-cost fossil fuel alternative in most regions across the world, according to the International Renewable Energy Association (IRENA).
The deployment of onshore wind has accelerated dramatically since 2010. Among all renewable energy technologies, onshore wind, after hydropower, has dominated the renewables industry, followed by solar. Onshore wind is expected to drive overall growth in renewables across several regions both in the mid- and long-term. Despite it requiring less cable than both offshore wind and solar, CRU estimates onshore wind still consumes approximately twice the amount of cable compared to a natural gas plant and four times more than a coal-fired plant, in terms of conductor kt per GW capacity installed. Undoubtedly, onshore wind deployments are a key driver of global insulated metallic wire and cable demand, especially with regards to power cable.
Onshore wind has grown four-fold over the past decade
In terms of global cumulative installed capacity of onshore wind power, it reached 596.4 GW at the end of 2019, according to IRENA. This is a four-fold increase from the 2009 level, or a CAGR of 15.0% between 2009 and 2019. 56.0 GW was added in 2019 alone, representing another increase of 10.4% y/y.
The levelised cost of electricity (LCOE) of onshore wind reduced to $0.056 /kWh on average in 2018, 35% lower than in 2010. This makes one of the cheapest generating sources currently and is expected to decline further as technologies advance. This, coupled with substantial cost reductions in installations ($1,497 /kW in 2018) will help onshore wind become one of the most popular choices for investment in new electricity generation plants.
On a regional basis, China is unquestionably the leader in onshore wind deployment, growing from barely 17.6 GW in 2009 to 204.5 GW last year, a 27.8% CAGR, and now accounts for nearly one-third of global installed capacity (see Figure 1). However, capacity growth slowed to 13.6% y/y in 2019, as the government began phasing out feed-in tariffs (FITs). China’s northern provinces such as Qinghai, Xinjiang and Inner Mongolia have the greatest onshore wind potential, yet the inadequate grid infrastructure to connect these renewable resource-rich sites to population-centric areas in the east and south remain a key constraint.
Europe and North America are also amongst world-leaders in terms of onshore wind capacity, together accounting for 51% of the global installed capacity base. Europe’s top three onshore wind markets are Germany (53.3 GW), Spain (25.5 GW) and the UK (14.2 GW). The primary challenge for Europe is to increase interconnections among countries in order to utilise the larger shares of electricity generated by renewables.
The US is expected to be one of the fastest growing onshore wind markets in the future, with capacity set to expand almost seven-fold by 2050, according to IRENA. Despite massive onshore wind potential in the central area of the country, this will require a number of new transmission lines to accommodate the growing onshore wind capacity in order to deliver electricity to the population centres found on the coasts. In short, onshore wind development will both support cable demand needed for wind farm construction itself and for electricity grid network expansion or upgrades, one of the many spill-over benefits.
What does this mean for wire and cable demand?
As with offshore wind technologies, onshore wind construction also uses 1) energy cable (all low voltage energy cables <1kV as well as power cables >1kV) for power connection within tower and tower to pad transformer; 2) winding wire for turbine transformer and farm step-up transformer, and 3) communication cable largely in the form of internal data cable for electronic equipment/device control purposes. Instead of inter-array cables and export cables which are used in offshore wind, onshore wind requires smaller amounts of inter-connecting power cables between towers and ground power cables, whereas these two types of cable are not needed in offshore wind.
Whilst the amount of cable used in onshore wind farms varies from project to project, depending on design specifications such as turbine size and layout, distance to grid infrastructure and local regulations, we believe our estimate for cable intensity below provides an accurate representation to reflect the industry as a whole as of 2019.
CRU also understands wire and cable intensity per project has been declining over the past few decades due to more efficient power management and a shift to cables with higher voltage ratings. Meanwhile, despite copper remaining as the predominant material of choice, energy cable and winding wire made of aluminium play a more prominent role in onshore wind than in offshore mainly due to cost considerations. This also implies less kt conductors of cable per GW in the future. All these factors are considered in the following forecasts.
Covid-19 has led to a number of delays for onshore wind deployments due to supply chain disruptions and uncertainties over future investment. Despite the near-term slowdown, acceleration of capacity deployment is expected to continue in both the mid-term and long-term, as clean energy transformation will likely be a core part of the post-Covid-19 recovery plan in many countries/regions.
The IEA presents two scenarios for renewable energy capacity forecasts, namely the main case and the accelerated case. In the main case forecast, it assumes a 57% increase in onshore wind capacity by 2024, from 2019’s level, or a net addition of 309 GW. CRU estimates around 590 kt conductors of insulated metallic wire and cable will be required to achieve this target as shown in Figure 2. This is more than the total amount of wire and cable consumed by Mexico and Spain combined as of 2019. Energy cable will account for 81% of the total cable demand, followed by winding wire (17%) and communication cable (2%).
The accelerated case assumes renewable capacity growth could by 26% higher than in the main case, in line with the objective to limit the rise in global temperature outlined in the Paris Agreement as mentioned above. If this case was to materialise, at least another 377 GW of offshore wind capacity will be added by 2024. This in turn will translate into approximately 700 kt conductors of cable demand, close to the total cable consumption of Germany as of 2019.
Onshore wind market will continue to grow in the long-term
The long-term outlook for the onshore wind market will remain favourable, thus also the related cable demand for this end use sector. According to IRENA’s REmap case, the total global installed capacity of onshore wind could grow more than three-fold by 2030 (a net addition of 1,190 GW from today’s level) and nearly ten-fold by 2050 (a net addition of 3,258 GW from 2030’s level) as shown in Figure 3. The underlying assumption of this scenario is also to keep the rise in the global temperature to well below 2˚C and closer to 1.5˚C by the end of the century.
China and India will lead global onshore wind power installations, with the two countries accounting for more than 50% of total global capacity by 2050. This is followed by the US, where installed capacity will expand more than eight-fold from today’s level reaching 857 GW by 2050.
CRU forecasts a total of 2.1 Mt conductors of additional wire and cable will be consumed between 2020 and 2030 to fulfil this installation target, with China accounting for more than half of the cable demand. In the long-term, the 2050 target of global onshore wind installed capacity in the IRENA REmap case would mean almost 4.8 Mt conductors of additional wire and cable demand from 2030’s level. This is equivalent to the total amount of insulated metallic wire and cable consumed in the UK over the past two decades.
In parts 2 to 3, CRU take a look at the offshore wind and solar industries and explore both current and future growth in capacity alongside cable intensities and related cable demand. In part 4, CRU provide a summary and detailed comparison of the three key renewable technologies and discus how growth in this sector is set to drive cable demand mid-term. If you would like to access the full insight series, and to find out further information about CRU’s Wire and Cable services, please click the ‘Explore this topic with CRU’ button below.