Asset Cost
Access Commodity Cost Curves & Asset-Level Cost Data for Mining and Metals
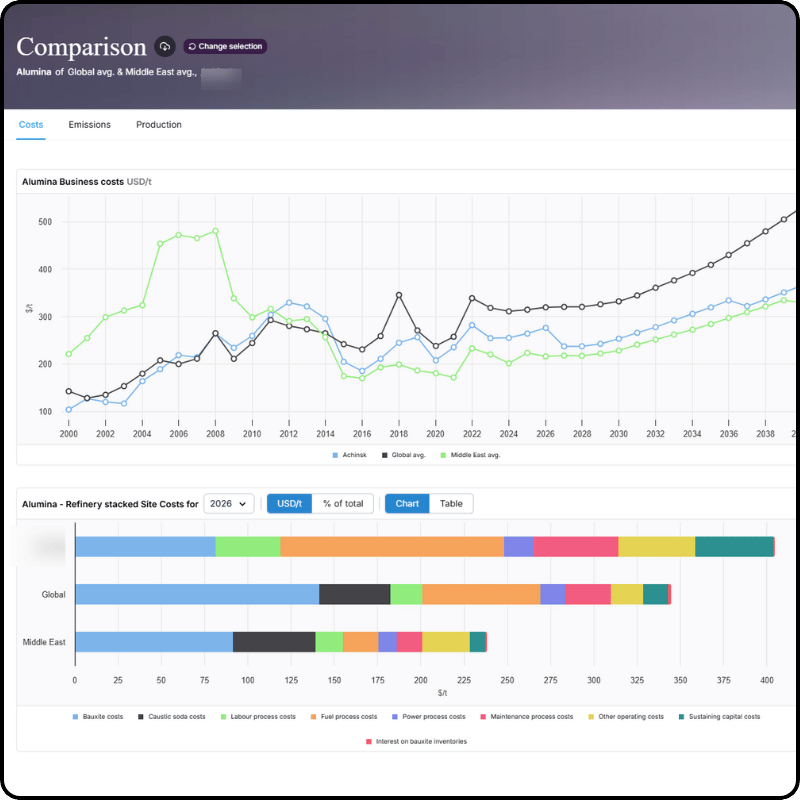
Understand the full cost profile of mining and metals assets worldwide with CRU's bottom-up asset data. Our cost benchmarking tools give you a granular, comparable view of cost performance across operating, development-stage and prospective assets – so you can make faster, better-informed decisions.
Identify Cost Position, Risk and Competitive Advantage
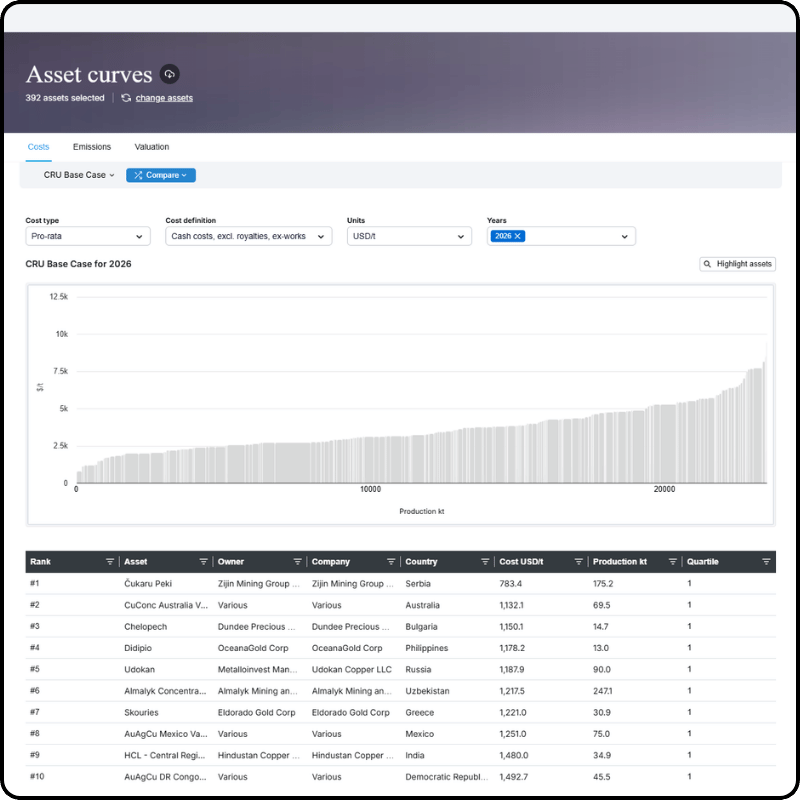
- Compare cost curves by commodity across assets, producers and regions using commodity cost curves
- Benchmark asset cost performance against industry peers with supplier cost benchmarking
- Drill into bottom-up cost analysis – inputs, material flows, energy, labour and more
- Run asset scenario analysis to model the impact of input cost changes on site cost positions
- Identify the lowest and highest cost producers on the global cost curve
- Access cost data for operating and development-stage assets including prospective projects
Bottom-Up Commodity Asset Data Built from First Principles
CRU's asset cost data is built from the ground up – not modelled from top-down averages. Our team of specialist analysts constructs bottom-up cost analysis for each site, capturing the full cost stack from mining through to processing and delivery. This bottom-up asset data approach means you can trust the numbers and understand exactly what is driving cost differences between assets.
Company-level cost visibility
Use Company Profiles to understand how a company’s assets sit across the cost curve, compare portfolio exposure by quartile and identify where competitive strengths or weaknesses sit across owned assets.
All cost data is accessible through the CRU asset data platform, with tools to build commodity cost curves, run supplier cost benchmarking and conduct supplier cost benchmarking across the commodities that matter to your business.

Supporting Better Decisions Across Teams
Commodity Producers
Benchmark your cost position against global peers and identify efficiency opportunities.
Financial Institutions
Support credit risk asset analysis, M&A asset analysis and investment screening with reliable cost data.
Commodity Traders
Understand the cost floor and marginal cost of production across global supply curves.
Industry Service Providers
Advise clients with confidence using analyst-backed commodity asset data on cost performance.