Full shipping abatement cost curve datapack is now available to Premium Energy Transition and Decarbonisation subscribers, containing carbon prices, added shipping fee estimates and alternative fuel costs. If interested, request a demo here.
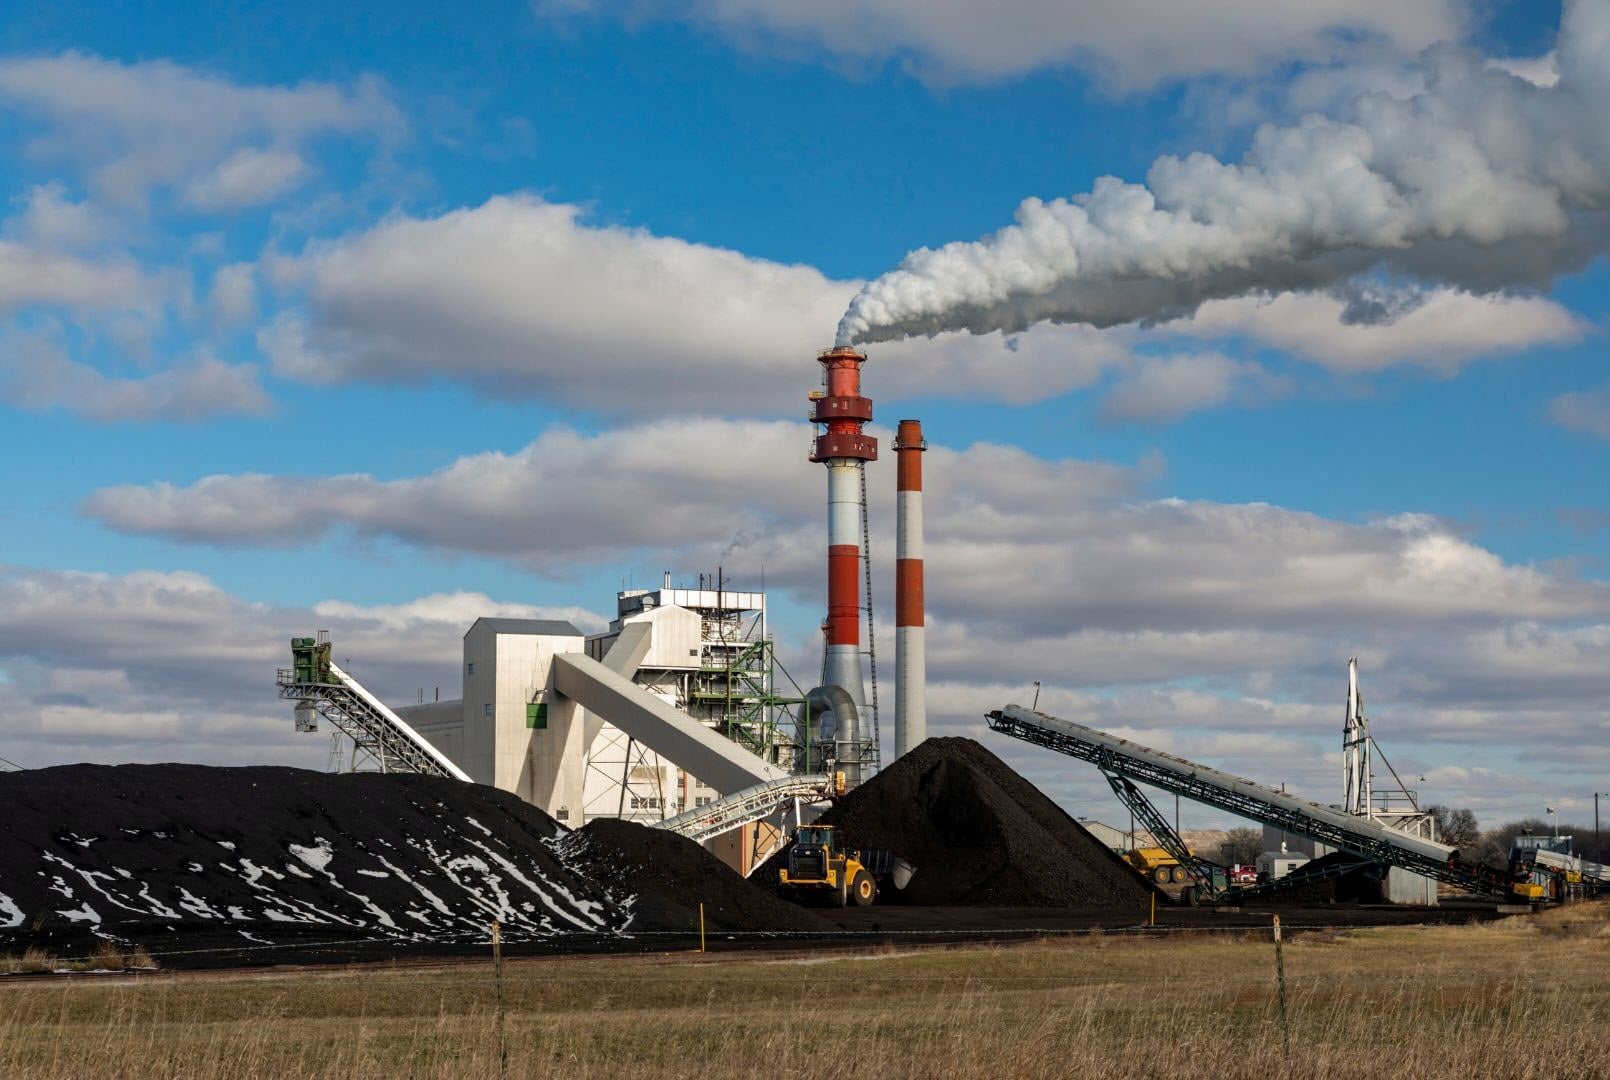
Shipping sits at the centre of global trade, representing ~80% of international trade and ~3% of global emissions. However, it remains one of the hardest sectors to decarbonise. Unlike many industrial processes, shipping depends on fuels that can sustain long voyages without undermining vessel economics, making the sector highly sensitive to fuel costs, energy density and onboard storage constraints.
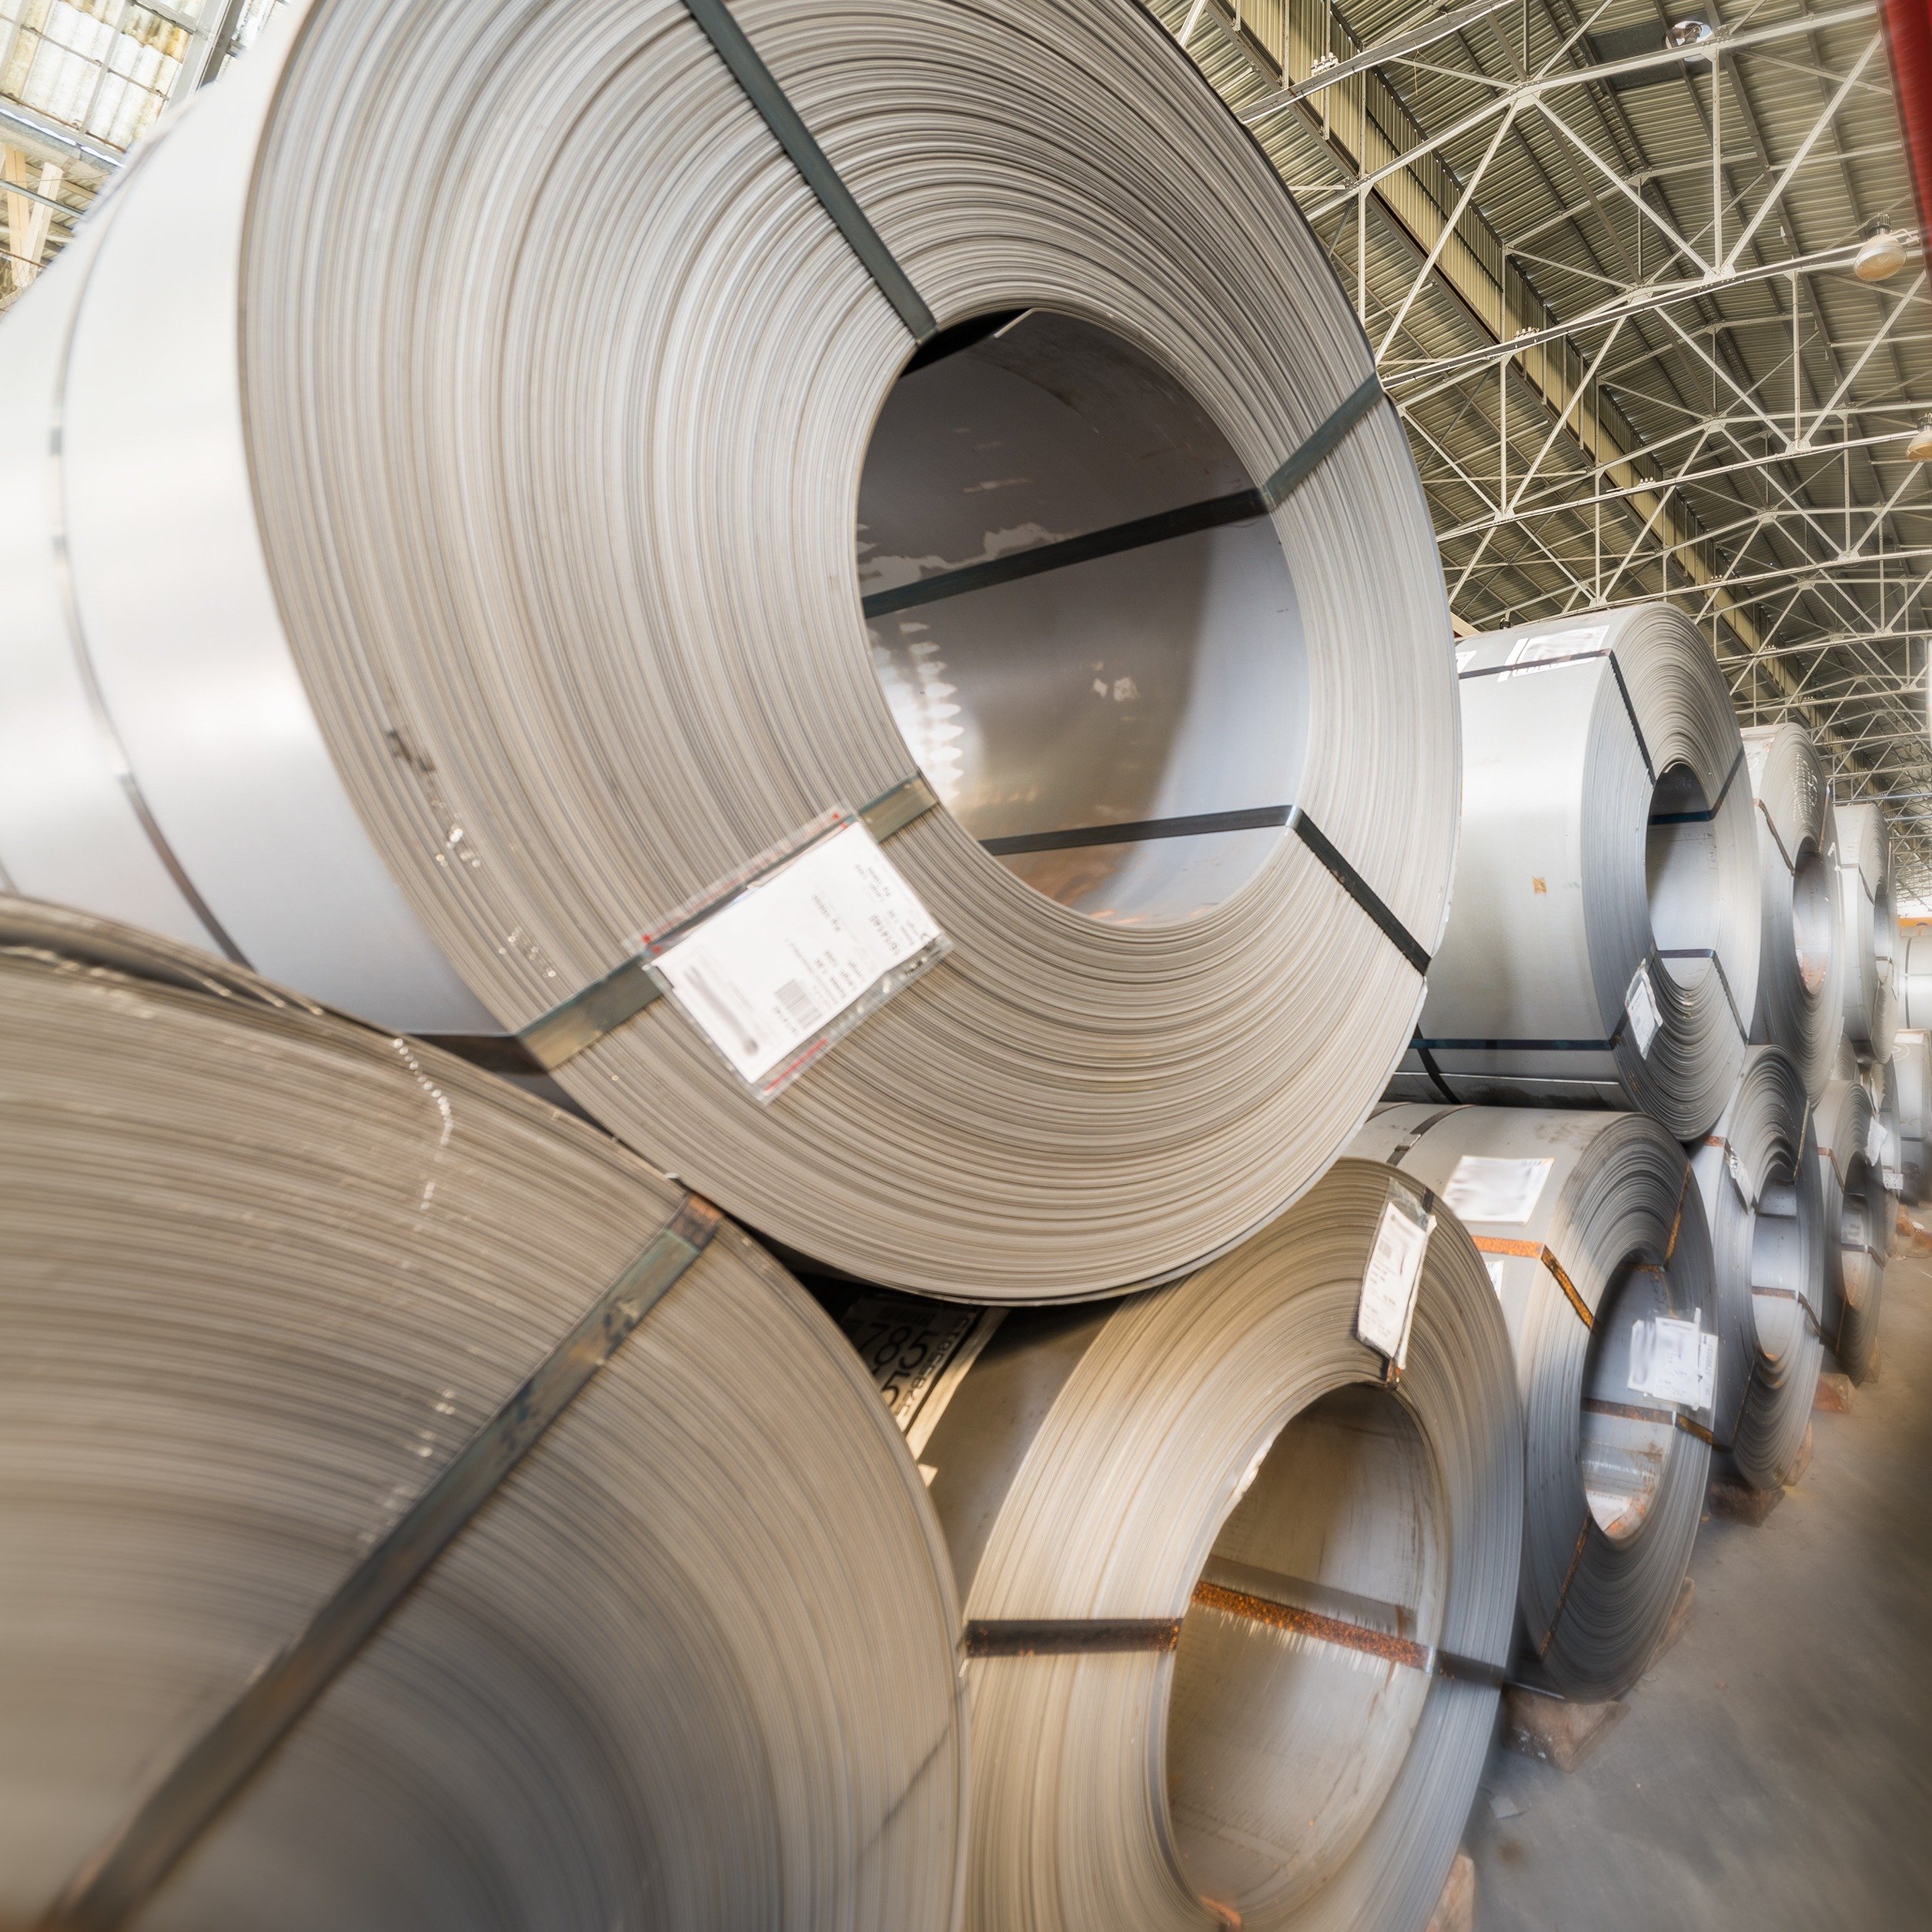
CRU has developed a shipping abatement cost curve that captures the carbon price required to incentivise fuel and technology switching across the existing dry bulk fleet. Our findings indicate that decarbonising the shipping industry requires full exposure to an average carbon price between ~$280–1,200 /tCO2 (real 2025) at 2030 costs, equivalent to an average shipping fee uplift of ~$14–58 /t dry bulk cargo for exporters.
The high-cost end of the shipping abatement cost curve tells a hydrogen story
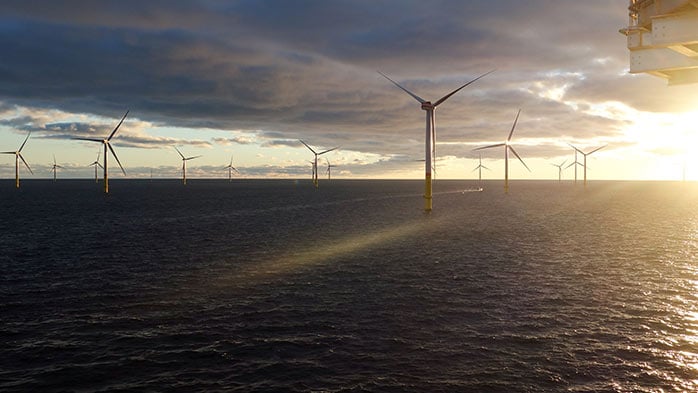
The shipping abatement cost curve above shows that the highest-cost pathways are the ones most exposed to clean hydrogen prices (i.e. e-fuel switching). Green ammonia and e-methanol sit at the top end of the ranking as both depend heavily on access to scalable, low-cost green hydrogen. In the case of e-methanol, there is an additional burden from the need to secure sustainable CO2, adding both cost and supply complexity.
At the other end of the curve, CCS retrofit sits at the low-cost end as it does not require fuel switching and, in CRU’s modelling, captures ~80% of onboard emissions. Biomethanol and BioLNG sit in the second tier, driven mainly by biomass feedstock prices and conversion yields. Fossil LNG appears less attractive than its reputation as a transition fuel might suggest as its narrower tank-to-wake emissions benefit means retrofit costs are spread across a relatively small volume of avoided CO₂. Under a full well-to-wake lens, its economics deteriorate further.
In 2025, the IMO proposed a global shipping carbon price of $100–380 /tCO2 under its Net-Zero Framework. Although it is yet to gain approval, the mechanism has been designed for adoption in 2028–2030. In comparison, CRU’s becomes increasingly interesting as the IMO penalty structure is only high enough to support lower-cost pathways such as CCS retrofit, some biofuel switching and, in some cases, fossil LNG on a tank-to-wake basis. The proposed framework is not yet sufficient to incentivise the premium tail dominated by e-fuel switching.
CRU has translated the carbon price requirements for fuel and technology switching into added shipping fee estimates for dry bulk fleet commodities.
The current geopolitical climate reinforces the relevance of shipping abatement cost curve analysis. As tensions and disruptions across key trade routes expose shipping to fuel price shocks and supply uncertainty, the search for alternative marine fuels is becoming as much about fuel security and supply chain resilience as it is about decarbonisation
A full datapack of model results, covering 2024–2050, is available to Premium subscribers of the CRU Energy Transition and Decarbonisation Service to view/download. If interested, request a demo here.
And if you want to know more about our work on abatement costs and process emissions, contact us, we’ll be happy to talk.