Co-Author Kevin Bai
Analyst View profile
The policy aim is to encourage cost reduction and technological progress, reduce the deficit of the solar fund and to cut back on un-used power generation. This move is expected to curb the fast growth in this sector given a feed-in tariff degression1 and thus will impact metal demand, primarily aluminium and steel, going forward. It is estimated that a total of 850 kt of steel and about 360 kt of aluminium consumption could be lost in 2018 due to this policy change effective 31 May. Although the negative impact stays moderate for aluminium and minimal for steel, it represents the government’s ongoing effort to further regulate the fast-growing renewable energy sector in a good way.
Background to the new policy
China’s drive to optimise domestic solar sector development
China is the world’s largest market for both photovoltaics (PV) and solar thermal energy. Since 2013 it has been the world’s leading installer of solar PV and in 2015 it became the biggest producer of PV power, surpassing Germany. According to China’s National Energy Administration, China’s on-grid new solar power installed capacity was 53 GW in 2017, after growth of 53.6% y/y.
China is among more than 50 countries that enacted feed-in tariff policies. Although several downward adjustments to compensation rates have been made over the past five years, subsidies have not always been well matched to the differential costs of solar generation and have increased the government’s financial burden. Moreover, given much solar power generating capacity has been built in remote areas in the less populated regions whereas the major electricity consumption areas are in the east, an increasing trend of curtailment rate was reported (6% for 2017) given difficulties and high expenses in transferring this electricity between regions. Government intervention and rationalisation has also been called for.
The highlight of the new policy is a reduction of the compensation rate, leveraged by a benchmark electricity on-grid price of RMB0.5-0.7/kwh for solar farms and RMB0.32/kwh for small PV system that connected to the grid wherever available, mainly for rooftop and residential use. The below table summarises the historical FIT degression.
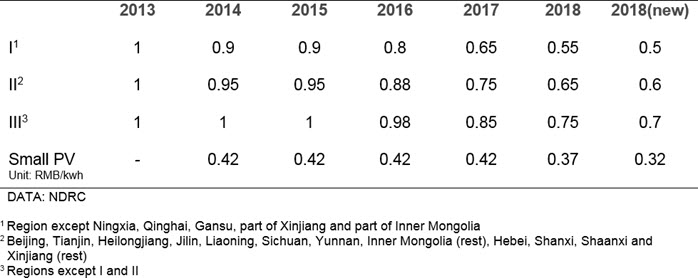
Given the fact that many solar power companies are relying on the government subsidy, the above reduction is expected to significantly hurt growth. China’s new solar power installed capacity reached 53GW in 2017. CRU assumes that this year’s additions will be much less due to the impact of this policy: 34.8GW, with 15.2GW having been installed by the end of May. It will also place increased pressure on solar companies to build new capacity due to the FIT degression in the rest of this year, when the demand impact on metals might be greater compared with H1.
Measuring the impact
Key assumptions
CRU’s estimation targets two major parts of a solar PV system, bracket and frame, which could be made from steel and aluminium. Two assumptions have been applied to quantify of the impact.
- Solar farms/parks (PV centre) mainly use steel in the brackets (primarily pre-fabricated corrosion-resistant steel structure) for cost-saving purposes and also to maximise lifespan, the frame system is mainly aluminium based given light-weight purposes.
- Rooftop and residential PV systems (small distributed PV systems) are mainly made of aluminium alloy for light-weight purposes as such residential buildings have load-bearing limits. (100% aluminium use)
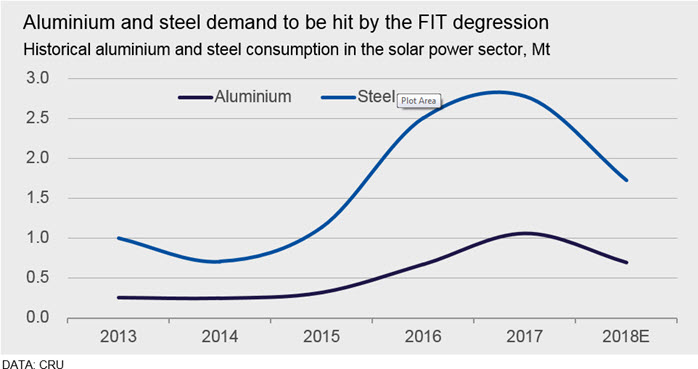
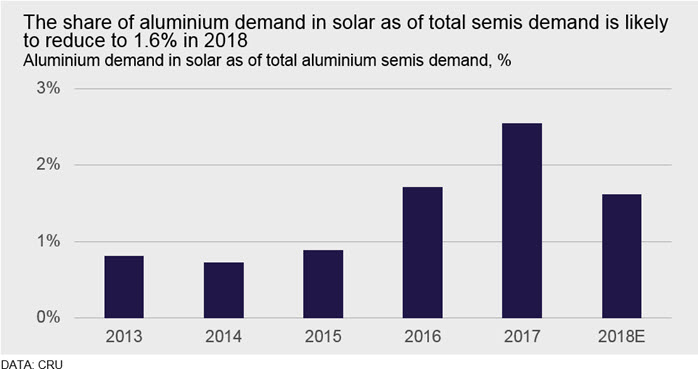
It is estimated that a total of 850 kt of steel and about 360 kt of aluminium consumption could be impacted due to this policy change. As the chart shows, aluminium and steel demand growth from China’s solar power sector really accelerated from 2015. But this year, the impact on steel demand is greater than that of aluminium, given that the government’s new policy measure aims for more control over PV centres, which are more steel-intensive.
The impact on aluminium will be moderate
According to Chinese official statistics, the total PV installed capacity in 2017 was composed of 37% small distributed PV systems which largely consume aluminium. CRU’s model shows that the solar power sector consumed 1.06Mt of aluminium extrusion in 2017, which took up 2.6% of the total aluminium semis consumption in the same year (41.6Mt). As the development pace in solar power sector has slowed down in 2018, the consumption of aluminium in this sector will decline and could drop to 700 kt, down by 34% y/y. This 360 kt reduction is moderate, compared to 43.1Mt of the total aluminium semis consumption in 2018.
The impact on steel will be minimal
CRU’s research shows that around 7%% of the total construction cost of a solar system consists of brackets which mainly use steel, and an estimate of RMB455k worth of brackets will be required to build a solar plant, with a rough per MW total investment of RMB6.5 million. Therefore, we can assume an average steel intensity of 83t/MW by calibrating an average coated steel sheet price of RMB5,500/t (including additional cost of processing and transportation).
According to official statistics in 2017, solar farms/parks form 63% of the total installed capacity. Therefore, the estimated steel use in solar sector can be calculated: 2.8 Mt in 2017 (53,000MW x 63% x 83t/MW). Taking CRU’s estimate of the 17.2 GW reduction given this new policy, the steel impact will be 856 kt, thus 952 kt for crude steel equivalent. This would mean that steel consumption in solar may drop by 38% y/y.
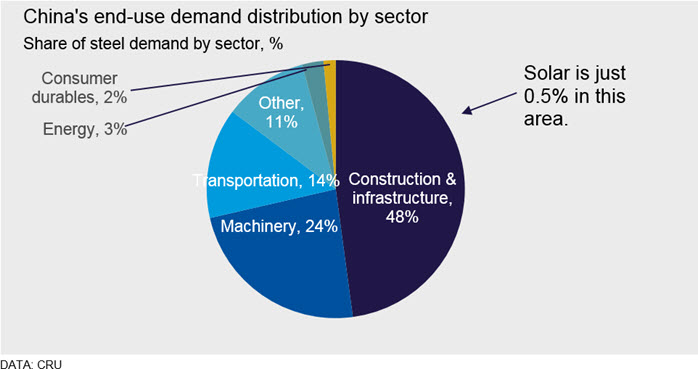
Although the y/y drop seems significant, this impact is minimal (as solar only takes up 0.5% of total construction and infrastructure demand, and the actual impact is just 0.15%) as compared with other major steel-consuming industries, such as construction, machinery and automobile manufacturing, therefore, won’t greatly impact our current steel demand picture.
Post-policy consumption change will be similar to wind sector
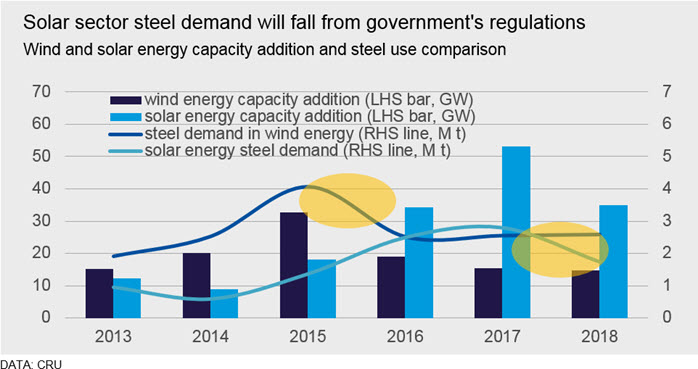
The adjustment in solar feed-in rates will likely lead to an annual reduction in steel and aluminium demand from the sector of 850 kt and 360 kt respectively in 2018. These are small volumes compared with total Chinese metals consumption though the post-policy change pattern of consumption is similar to that previously observed in the wind energy sector. In the latter case, a change to regulation resulted in a moderation in growth from 2015 (see chart below). Though both sectors will continue to see sustainable growth we have scaled-back our renewable capacity growth forecast by 71 GW, or 19%, by 2022 (though renewables continue to dominate power generation additions in China through to 2022). This will translate into an increased Chinese thermal coal demand forecast and we now expect consumption to grow by 2.2%/y during the period 2018–2022.
End notes:
1. Feed-in tariff (FIT), AKA renewable energy payments, is a policy mechanism designed to accelerate renewable energy development. FIT often includes a degression in order to track and encourage technological cost reductions over time.
Explore this topic with CRU
Co-Author Kevin Bai
Analyst View profileThe Latest from CRU
Key takeaways from CRU’s Wire and Cable Amsterdam conference
CRU held its seventeenth consecutive Wire and Cable conference in Amsterdam, during 24–26 June 2024. Day 1 kicked off with a warm welcome to around 200 conference...