In volatile markets, being able to make robust, data-driven decisions at speed is vital.
Deciding whether to invest or divest, increase capacity, or reduce production – all these decisions can deliver greater returns when made ahead of the market. Within the fertilizer industry, for example, having a deep understanding of the Chinese cost floor, the interaction with prices and the dynamics within that market are key to understanding the health of the global fertilizer market – essential ahead of making any robust strategic decisions.
For the first time, CRU’s new Fertilizer Cost Analysis Tool gives you reliable, granular cost information on the global fertilizer market in an intuitive and highly visual tool, allowing you to understand, evaluate and make recommendations faster and more reliably than ever before. This new service builds on years of development of bespoke “bottom-up” models, site visits and conversations with the industry.
Let’s take a working example: the Chinese cost floor
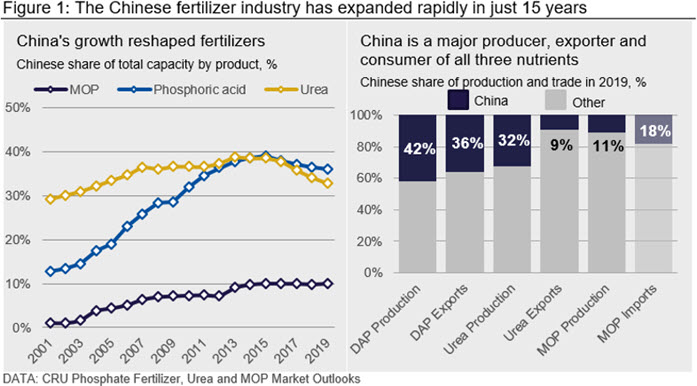
China’s influence in the fertilizer industry has grown substantially since the early 2000s. Chinese production capacity across all three nutrients grew rapidly and now the country is the largest producer of DAP, MAP and urea. The rapid expansion of Chinese fertilizer producers was not driven entirely by economics or typical return on investment metrics. Government policy and a drive for food security have been critical in shaping the Chinese fertilizer industry.
Chinese fertilizer production increased dramatically from the early 2000s to 2015. However, Chinese producers have struggled over the past five years. Urea and phosphate capacity have fallen since 2015 due to higher costs, tighter environmental policy and competition from global competitors. Furthermore, producers are coming under increased financial strain as these aforementioned factors bite.
Chinese producers are key in setting price floors and having access to clear information about the drivers behind those pricing decisions is critical. Understanding the cost structure of the Chinese fertilizer industry is essential in understanding the overall profitability of the fertilizer market.
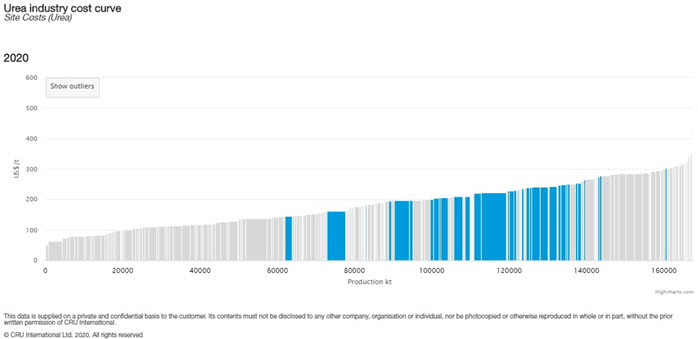
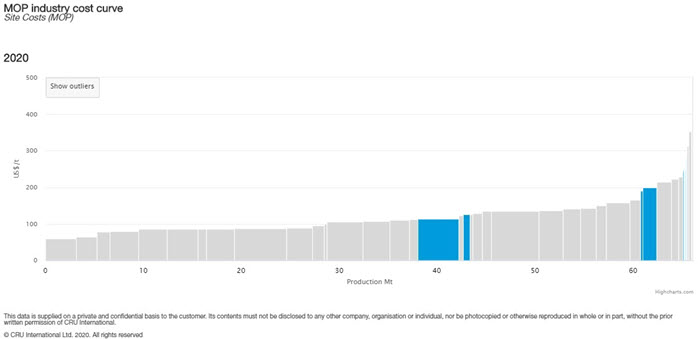
Chinese capacity flood recedes… exposing cost weakness:
When we look at the data, we can see that most Chinese producers occupy the third and fourth quartiles of the site cost curve. There are many other low-cost producers that could out-compete China on a cost basis, but the volume supplied by China gives Chinese producers power. It is highly unlikely that large producers in MENA or CIS, where costs are low across the nutrients, would be able to replace such a large quantity of capacity in the foreseeable future. China will not disappear from fertilizer traded markets, but now these producers must operate in a much more challenging environment. Chinese exports are now marginal for both DAP and urea. Now, as these high cost Chinese producers drop in and out of the market, due to cost/price dynamics, this will cause a price reaction potentially slowing price declines or capping price increases.

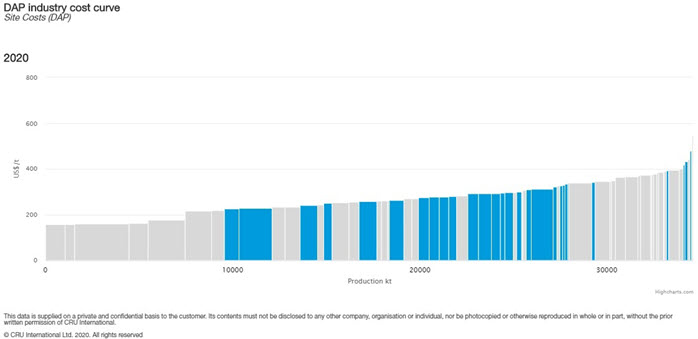
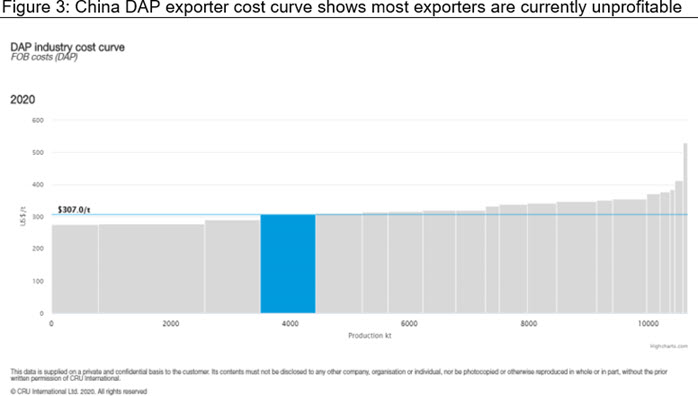
Site costs vs. FOB costs – how long can Chinese DAP producers hold on?
Building on from this, when we look at FOB costs (which include the additional costs required to export, finance, and market the product) and combine this with the spot DAP FOB China price on April 30 ($307/t taken from CRU publication, Fertilizer Week), we can see that, at this price, many Chinese DAP producers are facing severe difficulties. The FOB cost curve shows that most of the Chinese exporters would lose money, with the breakeven producer being YTH. A weak domestic market and increasing competition on the export market have, and will continue, to pressure Chinese producers like never before. A Chinese industry struggling to adjust to the new normal opens up wider opportunities and challenges to the global market.
Decision time.
It’s clear that Chinese producers are facing some tough choices ahead, and the rest of the global fertilizer market will need to anticipate those options in order to respond in a robust and timely manner.
The Fertilizer Cost Analysis Tool is built to support those decisions.
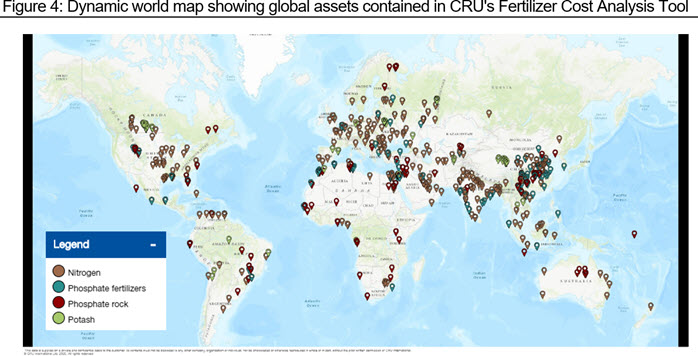
It covers more than 600 assets in 85 different countries across the nitrogen, phosphate and potash industries and delivers highly detailed cost information in an interactive and accessible online platform. Users can deep dive into each asset, understand what drives the particular cost of production and easily compare it to different assets. The focus on accessible data, visual tools, interactivity and transparency of assumptions delivers unparalleled value, and our global coverage is supported by offices and analysts based in key markets, including China, India, and the United States, ensuring our data is always up-to-date, verified and reliable.
What’s more, when combined with the price information from a Fertilizer Week subscription or the short term price forecast contained within a Market Outlook, it becomes a uniquely powerful tool that gives you robust information at your fingertips and allows you to make data-driven decisions easily and quickly.
Let’s continue the conversation…
What challenges does your organisation face? What decisions are you facing in the short and medium term? CRU can provide you with robust information and easy-to-use analysis tools that bring our independently researched, rigorous data to life – and which save you the time and effort of developing laborious in-house solutions. Why not get in touch today and see for yourself how quickly and easily the Cost Analysis Tool can help to shape the answer to your challenges and inform your strategic decisions: