Robust models lie at the heart of CRU’s W&C service
Following an extensive consultation period with the industry and senior leaders across CRU, we outlined the project, agreed timelines, and set two key over-arching targets:
- Provide increasingly reliable and robust forecasts for demand, trade, and production across the six cable products that CRU tracks by ensuring the forecasting platforms are future proofed and capable of responding to market shocks while also allowing extensive scenarios analysis.
- Provide more granular data with a focus on emerging economies.
Along with a multitude of associated smaller platforms, the above has been primarily delivered through the creation of two new forecasting platforms: a wire and cable demand model, alongside a wire and cable trade and production model.
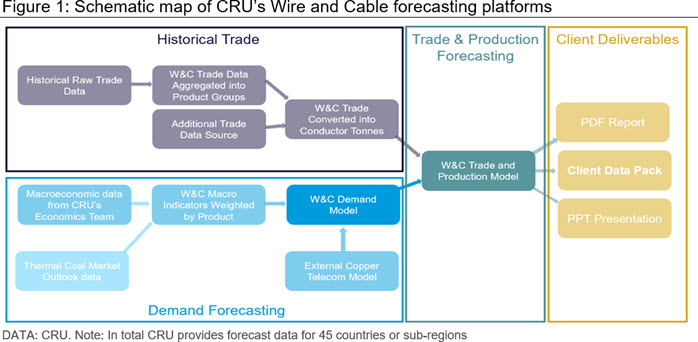
We want to take this opportunity to showcase how these models improve our forecasts and how they complement, rather than substitute for, good data and analyst expertise. The main benefit of models, used wisely, is that they mitigate against the simple bias of extrapolating recent growth rates. At the same time, they also allow for expert analyst adjustments to reflect market conditions not driven by macroeconomics, such as stock building, supply shocks, trade sanctions, and material substitution. These more dynamic, and flexible models help ensure robust forecasting across all geographic areas and product groupings.
What are the key outcomes?
More robust, reliable, and responsive forecasts
CRU has been using econometric models for predicting wire and cable demand for several years. However, in this revamped model we have utilised a greater array of macroeconomic indicators supplied by our in-house Economics team, alongside internal proprietary forecast data surrounding electricity consumption as generated by the Thermal Coal team. This is then underpinned by CRU Sustainability’s in-house assumptions surrounding the energy transition and rise of renewables.
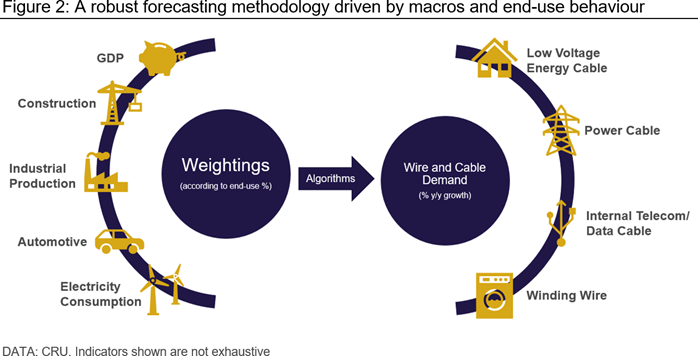
Through detailed regression analysis, the indicators we now use have proven to be highly relevant to the wire and cable market. This includes GDP, construction, industrial production, automotive production, and electricity consumption. A key differentiation in the new model is that we also consider the importance of each indictor to a specific cable category in a specific country. As shown in the infographic below, we assign a unique weighting to each indictor according to the share of cable consumption in that specific end-use sector directly linking to the indicator. Our proprietary weightings are dynamic and have been developed and refined over the past two years and utilise our deep and long-standing market knowledge.
To provide a specific example, we understand the automotive industry has a more prominent role in German wire and cable consumption compared to many other countries. Thus, we assign higher weightings to German automotive production forecasts in our algorithms when forecasting low voltage energy cable and winding wire demand. By linking macroeconomic indicators directly with their corresponding cable end-use sectors on a country-by-country and product-by-product basis, we believe this will undoubtedly improve our forecast quality and accuracy, while allowing for greater flexibility to respond to the latest market developments. One other important feature the new platforms provide is the ability to run detailed scenario analysis, something CRU will be covering in a future Insight.
In CRU’s new wire and cable trade and production model, we have now automated and expanded our trade data collection processes. We are now collecting wire and cable trade data from all 246 countries (supplied by our third-party trade data provider) and are able to easily switch between direct and deduced trade data, when necessary, dependent on the perceived accuracy of such data.
In our previous model, we only collected major countries’ trade data in certain regions. Take ‘Australasia’ as an example. We used to collect trade data for Australia, New Zealand, Fiji, Papua New Guinea, Samoa, Solomon Islands and Vanuatu in the previous model. But in our new model, we now collect trade data from all 33 countries in the Australasia region. Despite the fact certain smaller countries’ cable trade can be almost negligible, this new approach provides a complete and enriched data set.
Both direct and deduced trade data are crucial for assessing global wire and cable trade flows. For example, India’s customs recently stopped reporting winding wire trade data (under HS.854411 and HS.854419) measured in weight from 2018. Thus, we switched to deduced trade to track Indian winding wire trade flows. If the country re-starts its reporting, it is then necessary to switch back to direct trade. The flexibility to change between the two is important, as a number of countries like Mexico, Egypt, Iran, and the UK have all changed the way they report in recent years. This is not to mention many countries are still lacking reliable customs trade data such as in the Middle East and Africa regions.
Why a standalone model for External Copper Telcom (ECT)?
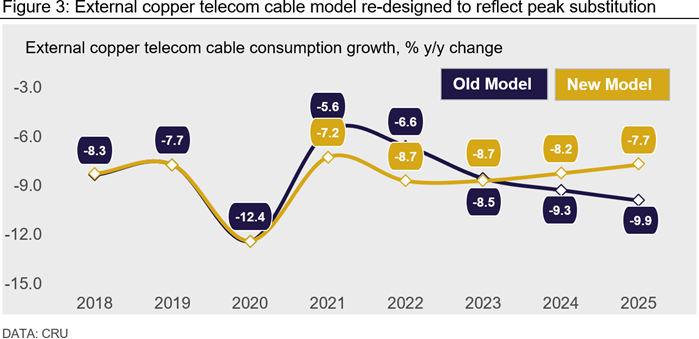
Demand for ECT cable has historically been primarily focused on the distribution and access portion of our old telephone, and later broadband, networks. With the gradual shift to full fibre and ‘copper switch off’ in many countries, demand has been contracting by double-digit growth rates for a number of years now. As such, the fate of ECT demand does not simply correlate with any macroeconomic indicators, rather technological advancements, network design and a country’s relative progress towards full fibre infrastructure.
It is for this reason we have developed a standalone model for ECT demand which utilises CRU’s in-house country-level data for fibre density, FTTx coverage and progress on any ongoing ‘copper switch off’ strategies. Due to a lack of flexibility, CRU’s old models used to broadly assume an acceleration of the rate of decline over the forecast period as substitution to fibre picks up pace. However, through intensive research, we understand a number of markets have already reached or will reach peak substitution in the near-term. This means the rate of contraction will decelerate in the coming years. Our new model takes this dynamic into account. On a country-by-country basis, we assess the respective peak fibre substitution year and then allow for the rate of demand contraction to subsequently soften.
Further compounding this view is an improved understanding over future usage for ECT cables. For example, we understand demand from the railway sector is looking promising in certain markets such as Spain and Italy. Therefore, we believe despite fibre substitution in the telecom market, ECT will remain a growing cable category within the transportation sector and hence slow the pace of decline for this cable category as a whole.
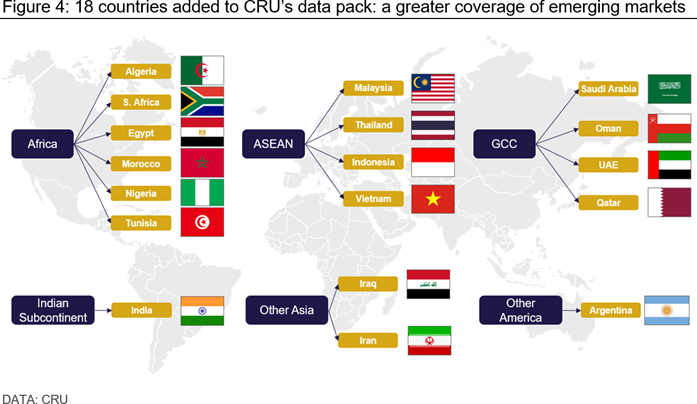
Increased country level coverage
One of the key benefits to CRU’s customers is the addition of 18 new countries into CRU’s Wire & Cable Market Outlook data pack. As can be seen from the chart below we have focused on adding both historical and forecast data for demand, trade, and production across key emerging economies. With this improvement, it now takes CRU’s coverage to 45 countries in total. With these new additions, we believe our service offering is more relevant than ever and reflective of an evolving industry.
Why CRU is the ‘go-to’ choice for Wire and Cable analysis
With these latest improvements to the Wire and Cable service, CRU’s unique position and experience within the cable industry, combined with input from our in-house Economics, Copper and Aluminium teams, CRU is the industry ‘go-to’ for high-quality wire and cable related data, information, and client support services.
We will continue to review our wire and cable service portfolio moving forwards and implement yet further improvements as the industry continues to evolve in a post-pandemic world. This will ensure we will stay ahead of the curve and highly relevant, which has proved more important than ever over the past two years.
By utilising the new platforms, CRU’s wire and cable demand forecast provides an even higher level of granularity to our clients. The service contains a more data-rich and comprehensive analysis of the future state of the industry, underpinning our understanding of wire and cable market conditions, trade flows, production, and demand. This analysis is delivered through CRU’s Wire and Cable Market Outlook service, if you would like to find out more about our services, please contact CRU via the form below.
Explore this topic with CRU