In the second edition of this annual Insight (view part one here), CRU takes a step back and review the key changes and developments in the optical fibre and cable industry in 2019, highlighting the lows and highs, alongside key moments and advances in technology.
Furthermore, we shine a spotlight on the key market moving topics and upcoming research areas CRU’s Wire and Cable Team will be focusing on in 2020.
Global growth dragged down by China in 2019
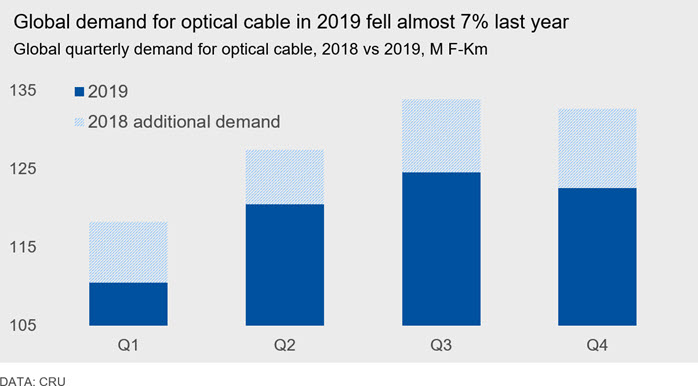
Whilst there were a few highlights in 2019, namely the launch of commercial 5G services in nearly 30 countries, it was perhaps a year to forget for many industry participants. CRU estimate global optical cable consumption on a fibre-km basis contracted by almost 7% y/y in 2019, marking the second weakest year in CRU’s records. In terms of market value, we estimate this fell more in the region of 24% y/y.
Whilst the level of the contraction last year pales in comparison to the -36% y/y posted in 2002, it proved to be a very tough year for producers across virtually all key markets. It was a year dominated by weak demand, excess capacity and rising inventory. It is however, the collapse in global bare fibre prices which has perhaps hurt producers the most. Let’s take a look at some of the driving forces behind this weakness and other key moments in the industry last year.
Selected highlights and lowlights from the 2019 optical fibre and cable industry
- The amount of optical cable installed worldwide decreased from the previous year for the first time since 2002. The quantity installed in 2018 exceeded 500 million fibre-km for the first time but then decreased below 480 million in 2019.
- Demand for optical cable in China decreased by double-digits from 2018 to 2019, marking a significant reversal to a ten-year trend (China's demand had increased 556% from 2008 to 2018, representing a CAGR of 21%).
- China Mobile's tender for standard telecom fibre and cable was 105 million fibre-km, the same amount as in its tender for H1 2018 (China Mobile never issued a second half tender in 2018). Counting the drop and specialty cables, China Mobile's 2019 demand was down 16% from 2018.
- Telecom operators in India, which is the world's third largest optical cable market, scaled back their optical cable consumption in 2019 mainly due to financial problems. Optical cable demand dropped off sharply after H1 2019, and some cable manufacturers have subsequently had to adjust production schedules and instead turn to exports.
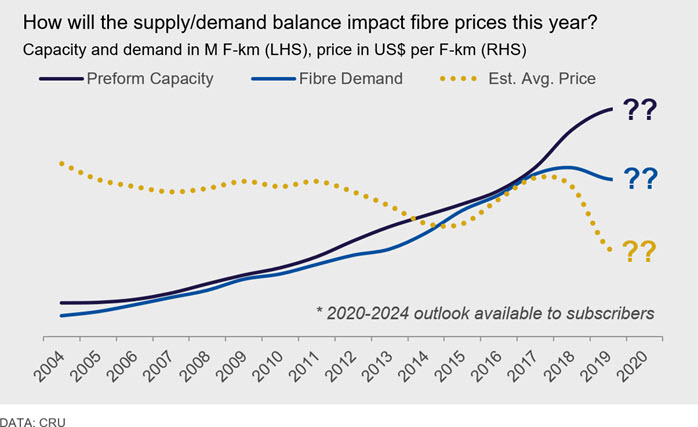
- Preform equipment activated in 2018 and early 2019 raised global capacity to more than 20,000 tonnes. This capacity, along with the lower demand caused the shortage to end and prices to plummet.
- Industry participants reported record-low G652.D bare fibre prices late-last year. Such low levels resulted in significant shifts in global trade patterns. The low prices also have stimulated new requests for anti-dumping investigations and other regulatory intervention in some markets, such as India and the European Union.
- China's fibre and cable manufacturers did not respond immediately to the downturn in their domestic market, and inventories built up to levels in excess of 20 million fibre-km in 2019. This contributed to the downward pressure on prices as well as the Chinese manufacturers' more aggressive strategies in export markets.
- 5G services commenced in approximately 30 countries, with the vast majority of global carriers having construction programs underway or in planning stages. Initial uptake has proven to be faster than LTE. (However, so far there is not yet enough data from 5G carriers to develop a useful ratio of fibre-km installed per 5G coverage area to help forecast optical cable demand in local cellular network installations).
- With the exception of the sharper downturns in China and India, most of the carriers in other large telecom markets throughout the world generally "stayed the course" in terms of construction plans. Procurement and inventory management, however, contributed to some H2 2019 flatness in monthly orders, namely in Europe and US.
- In the US, Verizon continued with its "high-density" plan to install high-count cables in access areas, but orders at some other operators, including AT&T decreased from 2018 to 2019. The US market total expanded moderately from 2018, but growth was slower than had been expected earlier in the year.
- Production of optical cable in Brazil rose sharply in both 2018 and 2019, supported by stronger-than-expected demand in Brazil and neighbouring markets. The outlook for the Latin American market remains one of our most buoyant.
- Hengtong’s JV with Leoni’s subsidiary, J-fibre, started production and sale of standard single-mode fibre to the European market in September. According to trade data, the first imports of preform made their way from China to Germany in August.
- Top optical cable manufacturers have continued to work on high-count cables with small outer diameters. Several companies have announced cables with more than 6,000 fibres, whilst Prysmian have launched a 180-micron bend-insensitive fibre. Applications include large data centres and data centre campuses.
- New long-distance routes are being installed with fibre counts in the hundreds. A new US long-distance carrier called Arcadian Infracom is installing 288-fibre cables and planning to equip them with DWDM systems transmitting at 100 and 400 Gbps per wavelength.
- As of 2019, FTTB+FTTP systems had passed 972 million premises. Of these, 481 million are in China, and 153 million are in other markets of the Asia-Pacific region. The world's total number of households is 1,937 million.
Outlook for 2020 still hinges on 5G deployment as the dominant driver of demand
As 2020 progresses, there will be more information about the amount of fibre installed in 5G infrastructure and other new local applications, especially as China ramps up 5G network construction in wide-scale rollouts. This should provide greater insight into the strength of the next generation of fibre deployment, “beyond FTTx”. Whilst it looks increasingly likely 2020 could be another lacklustre year, commercial 5G rollouts elsewhere and rising fibre counts should help provide an uptick in demand moving forwards. With this in mind, let’s take a look at some of the key market drivers for the upcoming year.
Examples of key topics we’ll be watching closely in 2020
- How much optical cable will be installed to support 5G networks in all markets, especially in China?
- There is considerable scrutiny of the business cases for 5G deployment -- who are the "early adopters," what services they are willing to pay for, etc. Will the experience in 2019 and 2020 give clarity as to how network operators will prioritise their capex and how rapidly they will deploy 5G networks?
- Will the amount of fibre installed in China during 2020 be lower, flat or higher compared with 2019? If growth resumes, how much more will be installed, and will growth continue ramping up through 2020? How does 5G network sharing impact this?
- FTTH deployments in France have contributed to strong year-over-year increases in optical cable consumption in recent years. Recently, some of the companies installing FTTH networks have said they are on track or ahead of schedule for their long-term targets. What will be the trend be in France's near-term optical cable demand?
- India's network operators have reduced their fibre deployments due to financial constraints. When will capex budgets and debt repayment allow for India's optical cable demand to resume growth? Will we see carrier consolidation?
- Brazil's optical cable market picked up in 2018 and 2019, showing much stronger growth than other sectors of the domestic economy. Will this cable demand continue growing at double digit rates in 2020? How about after that?
- Network operators in Germany and the UK have expressed commitments to install FTTH systems in smaller communities and rural areas, but the progress in these markets has been slow. Will private and public funding resources become more available in 2020? Will the number of premises passed show significant growth?
- In the US, how much fibre will Verizon install in its high-density access-network projects? Will the quantity be more than in 2020, and if so, will this growth offset lower orders from other large carriers?
- Will construction of hyperscale data centres show growth from 2019 to 2020, and if so, in what countries? What types of fibre will be preferred inside data centres, and what will typical fibre counts be?
- The demand for transoceanic fibre networks has achieved high levels in recent years, in part with financial commitments from Alibaba, Amazon, Baidu, Facebook, Google, Microsoft, Tencent and others.
- In recent years, Hengtong and ZTT have gained a position in the global market for fibre optic undersea systems. FibreHome, Futong, and YOFC also are making investments. TE Subcom was sold in late 2018, and there have been reports that Nokia has considered purchase offers for the Alcatel Submarine Networks? Will the fibre undersea systems business achieve a reasonable balance between supply and demand? What cable manufacturers will thrive or grow?
- Since 2018, China has had excess fibre and cable capacity, weaker market demand, and prices so low that margins are negligible or negative. Some of the fibre and cable makers also have significant debt burdens from loans taken for recent factory expansions. In this environment, is there any chance that some companies will exit the business or undergo restructuring/bankruptcy proceedings?
- Will bare fibre and cable prices rebound? CRU expect any meaningful improvement to come only when the severe excess capacity and elevated inventory issues are addressed. We could very well be entering a structurally lower pricing era.
CRU will be tracking developments in these key areas closely over the coming year, providing in depth commentary and analysis across both the Optical Fibre and Cable Monitor and the Telecom Cables Market Outlook. If you have any questions about CRU’s Fibre Optic Portfolio, or indeed would like to see the numbers behind the statements and charts above, contact us via the button below.
Wire and Cable Team
-

Egest Balla
Research Analyst - Wire & Cable Pittsburgh -

Robert Edwards
Principal Analyst London -

Joseph Gil
Senior Analyst London -

Aisling Hubert
Senior Analyst London -

Natalie Noor-Drugan
Editor in Chief London